
FIGURE 2.
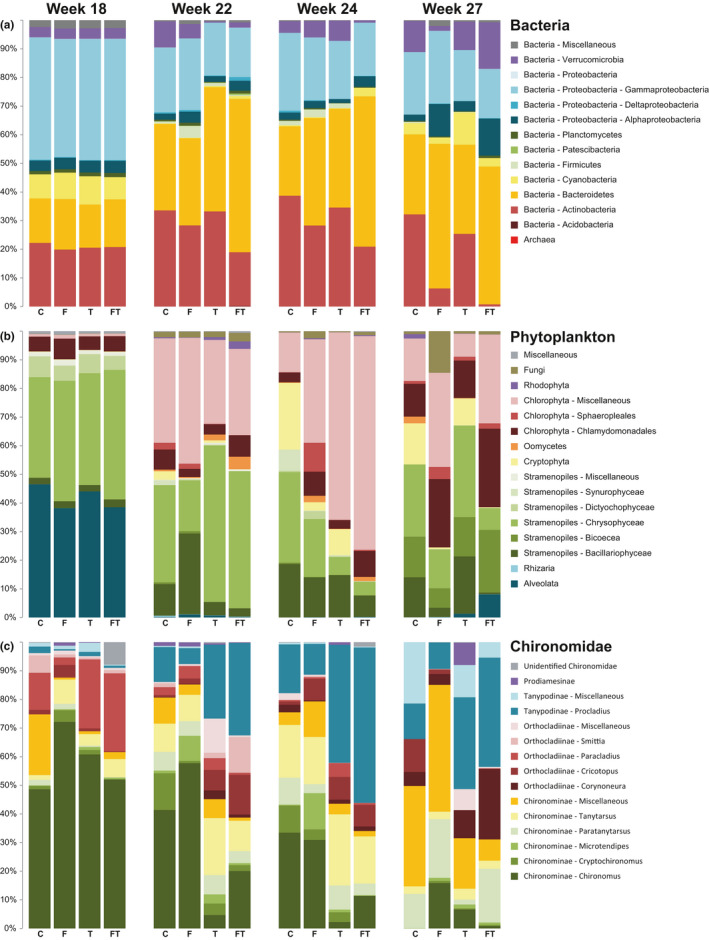
Read distributions observed for each of the different treatments and control both prior to (week 18) and after application of treatments (weeks 22–27) for each of the taxonomic groups. (a) Bacteria, (b) phytoplankton and (c) chironomids, in control situation (C), and with added fertilizer (F), thiacloprid (T) and combined treatments (FT)