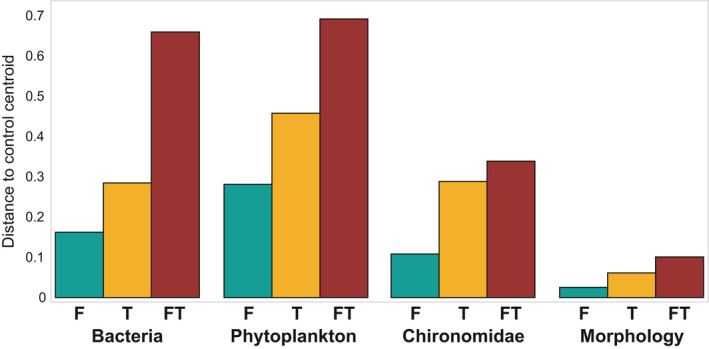
FIGURE 3.

Centroid distance to the control centroid in week 24 (1 month after application of the agrochemicals), for the bacteria, phytoplankton, and chironomids assessed with environmental DNA, as well as the macroinvertebrates assessed with morphological methods (see Barmentlo et al., 2019), exposed to fertilizer (F), thiacloprid (T), and combined agrochemical addition (FT)
