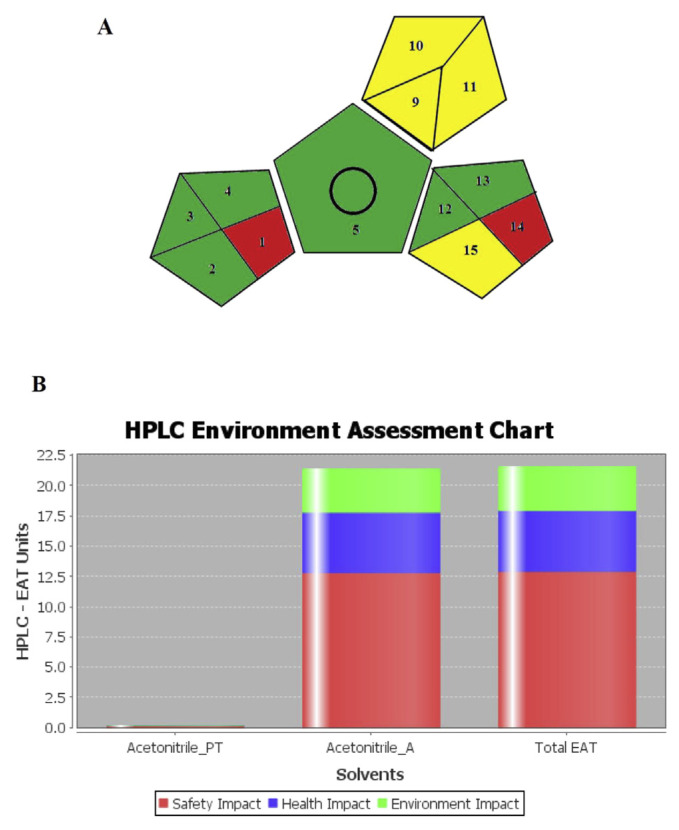
Fig. 4.
(A) GAPI pictogram for the developed HILIC method (references to numbers shown in the pictogram are provided in Supplementary Material Tables S1) and (B) HPLC-EAT chart for the developed HILIC method (Acetonitrile_PT: acetonitrile in the standard solution, Acetonitrile_A: acetonitrile in the mobile phase).

