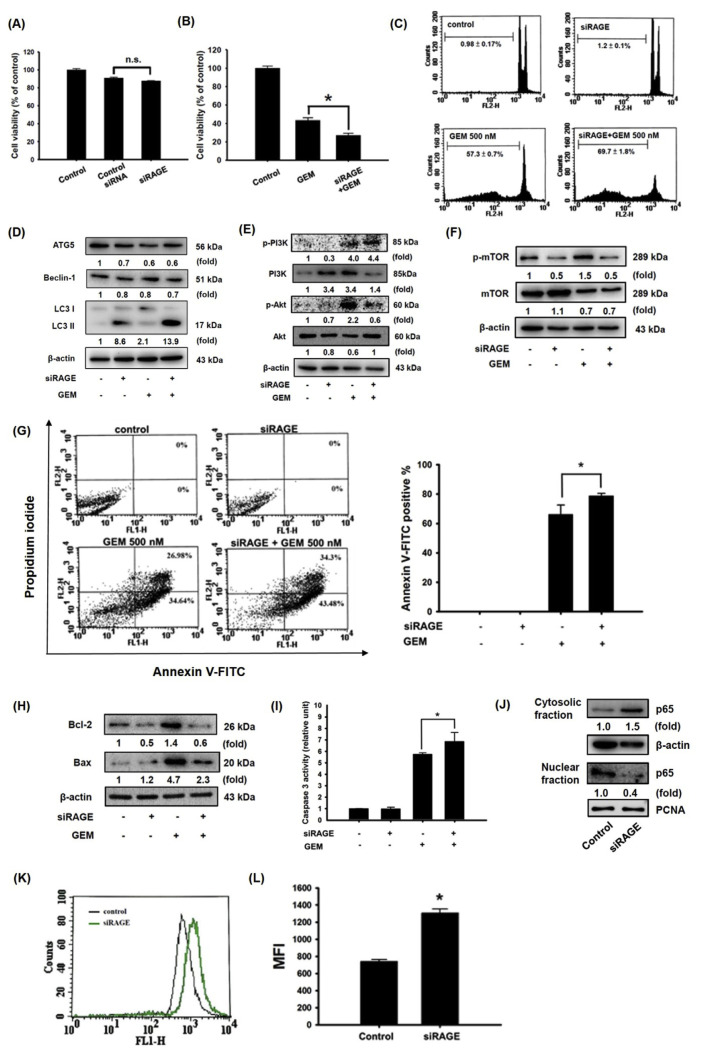
Fig. 2.
Enhanced effect of RAGE-specific siRNA and GEM in inducing the cell death of MIA Paca-2 cells. Cells were transfected with RAGE-specific siRNA for 24 h and then treated with 500 nM GEM for 72 h. (A, B) Cell viability. (C) Sub-G1 phase. (D) Autophagy-associated ATG5, Beclin-1, LC3I, and LC3II protein expression. (E) Akt, PI3K, and (F) mTOR protein expression. (G) Apoptotic cells were stained with Annexin V-FITC positive/PI negative staining. (H) Bcl-2 and Bax protein expression. (I) Caspase 3 activity. (J) Protein levels of p65. (K, L) Effect of RAGE knockdown on the mean calcein fluorescence intensity in MIA Paca-2 cells. Reported values are means ± SD (n = 3), *p < 0.05 versus the control. (n.s. = Not significant). MFI: mean fluorescence intensity.

