FIGURE 2.

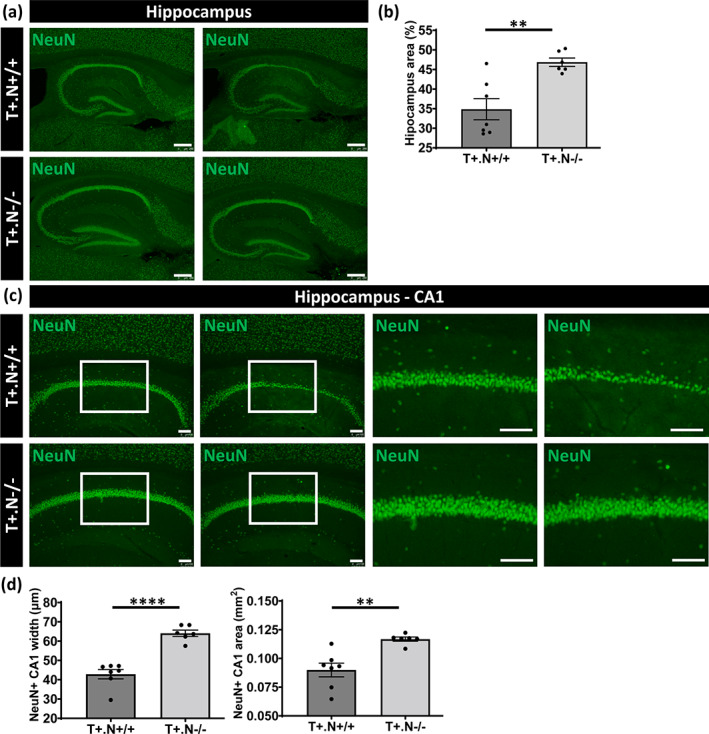
Hippocampal atrophy and neurodegeneration in tau.NLRP3 mice. (a) Representative images of NeuN (neuronal nuclear antigen) staining of the hippocampus in well‐defined brain slices of 10‐month‐old tau.NLRP3−/− (T+.N−/−, lower panels) and tau.NLRP3+/+ (T+.N+/+, upper panels), used for measuring the hippocampal area. (b) Quantitative analysis showed significantly decreased total hippocampal area in T+.N+/+ compared to T+.N−/− mice. (c) Representative images of NeuN immunostaining of the hippocampal CA1 region of T+.N−/− (lower panels) and T+.N+/+ (upper panels) mice. Higher magnifications of selected areas (white squared boxes) are shown on the right. (d) Quantitative analysis showed significantly decreased width of the NeuN positive (NeuN+) neuronal layers in the CA1 region (left side) and decreased NeuN+ CA1 area (right side). Data are shown as mean ± SEM (T+.N+/+: n = 7; T+.N−/−: n = 6; *p < .05, **p < .01; unpaired Welch's t‐test; hippocampus, bar = 250 μm; CA1 region, bar = 100 μm)
