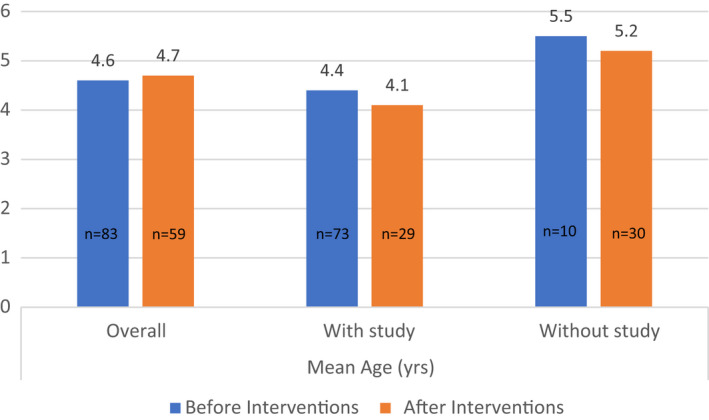
FIGURE 3.

Mean ages of children seen in sleep clinic pre intervention and post intervention. Graph showing the mean ages (years) of ENT‐referred children for investigation of OSA seen in sleep‐disordered breathing clinic before and after intervention
