
FIGURE 6.
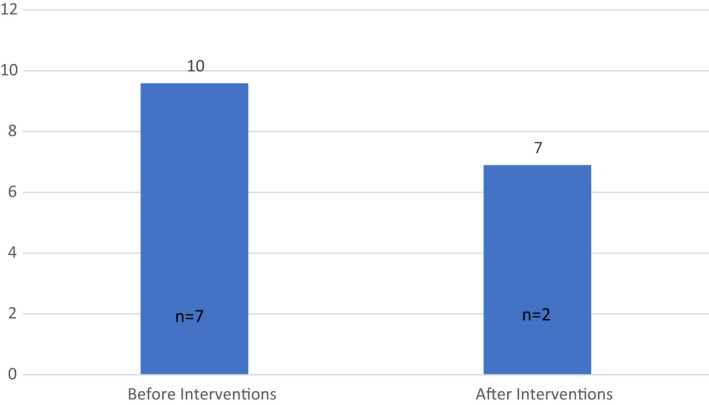
Percentage of sleep studies conducted failing at first attempt. Graph showing the percentage of children, referred by ENT to sleep clinic for investigation of OSA, undergoing a sleep study who had a first–time study failure, before and after intervention (10% [7/73] before intervention compared to 7% [2/29] after intervention)