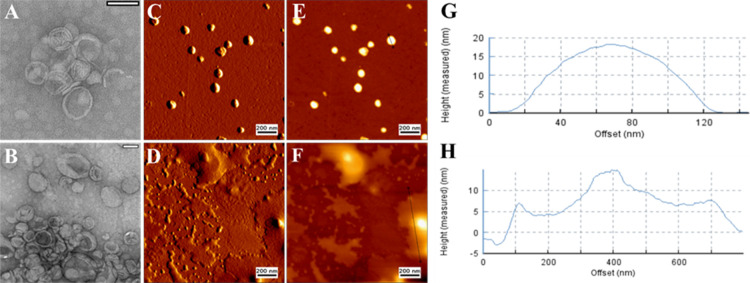
Figure 5.
Representative TEM images of (A) DHβCD-TSL at 25 °C and (B) DHβCD-TSL after NIR irradiation (λ = 785 nm, 500 mW). Scale bar: 100 nm. AFM micrographs of (C) DHβCD-TSL at 25 °C and (D) DHβCD-TSL after NIR irradiation (λ = 785 nm, 500 mW). Scale bar: 200 nm. (E, F) Cross sections of liposomes in measured height trace with identified lines. (G, H) Height of the cross-sectional profile along the identified line.

