
FIGURE 4:
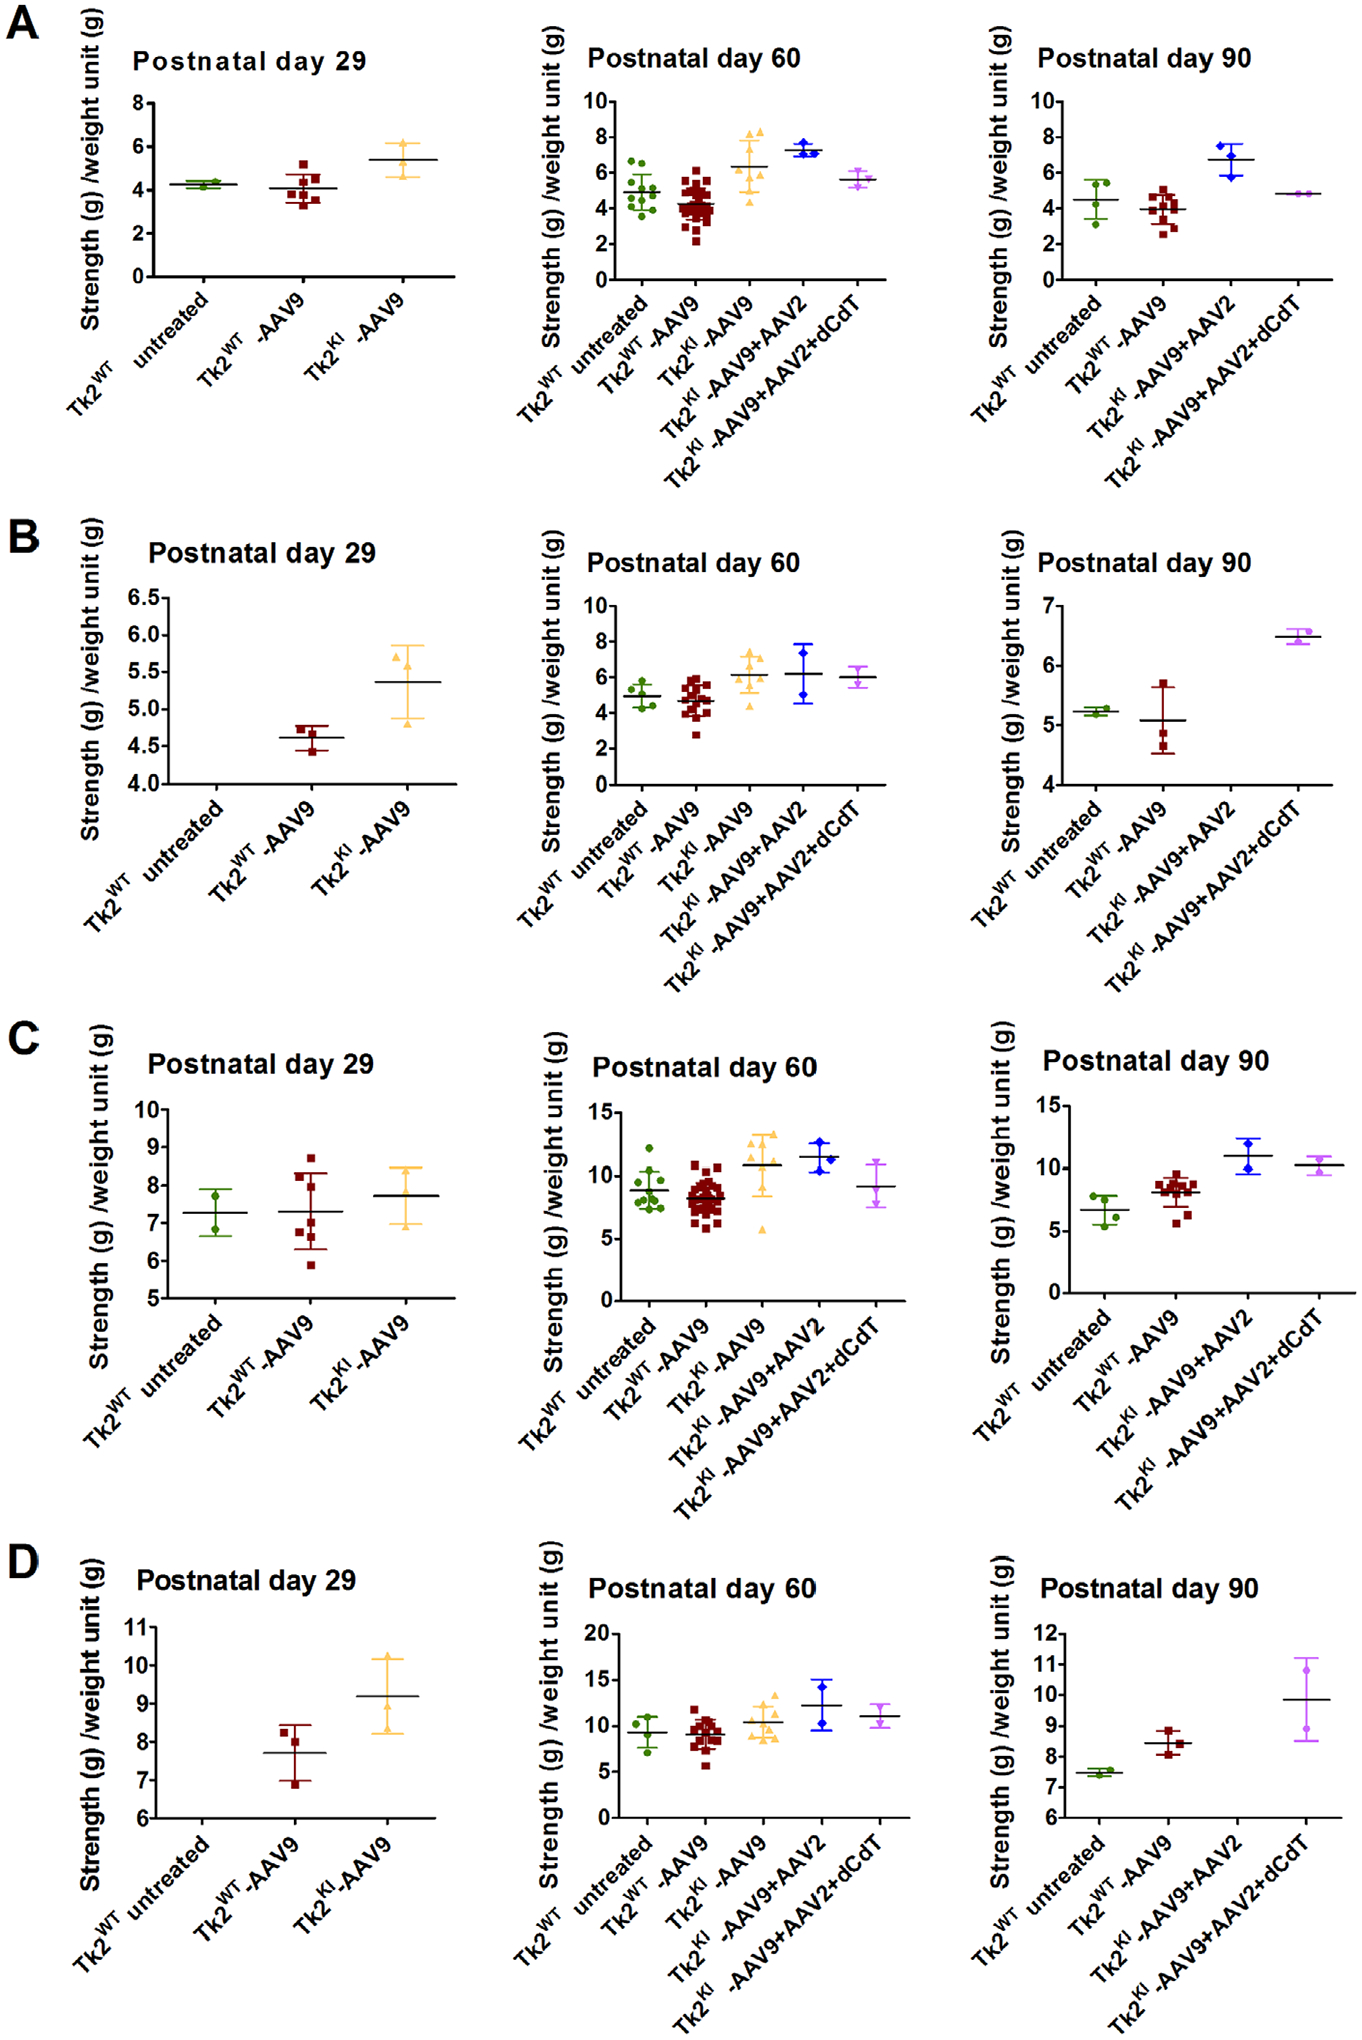
Grip test. Panels (A) and (B) shows bar test (upper limbs) in male and female mice, and panels (C) and (D) displays grid test (4 limbs) in male and female mice. Data are expressed as strength (measured in g) per weight unit (g). Each symbol represents the average of 3 tests of a single mouse. For each treatment group, average and standard deviation are represented. Tk2WT-AAV9 and TK2KI-AAV9 refer to the high-dose group (4.2 × 10¹¹ vg).