. 2021 Aug 5;20(10):2016–2025. doi: 10.1158/1535-7163.MCT-20-0987

Figure 3.

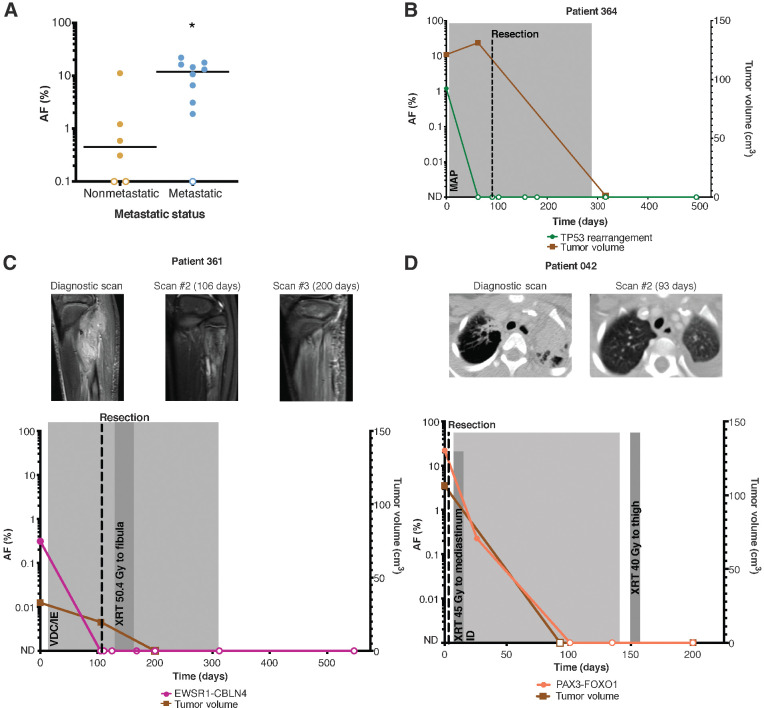
Figure 3. ctDNA levels correlate with clinical features. A, Metastatic patients (n = 10) had higher levels of pretreatment ctDNA compared with nonmetastatic patients (n = 6). P value = 0.0224 (calculated by the Mann–Whitney U test). Serial ctDNA levels detected by CAPP-seq reflect response to therapy in osteosarcoma (B), Ewing sarcoma (C), and alveolar rhabdomyosarcoma (D). ND, not detected; M, methotrexate; A, adriamycin; P, cisplatinum; V, vincristine; D, doxorubicin; C, cyclophosphamide; I, ifosfamide; E, etoposide; XRT, radiotherapy.

ctDNA levels correlate with clinical features. A, Metastatic patients (n = 10) had higher levels of pretreatment ctDNA compared with nonmetastatic patients (n = 6). P value = 0.0224 (calculated by the Mann–Whitney U test). Serial ctDNA levels detected by CAPP-seq reflect response to therapy in osteosarcoma (B), Ewing sarcoma (C), and alveolar rhabdomyosarcoma (D). ND, not detected; M, methotrexate; A, adriamycin; P, cisplatinum; V, vincristine; D, doxorubicin; C, cyclophosphamide; I, ifosfamide; E, etoposide; XRT, radiotherapy.