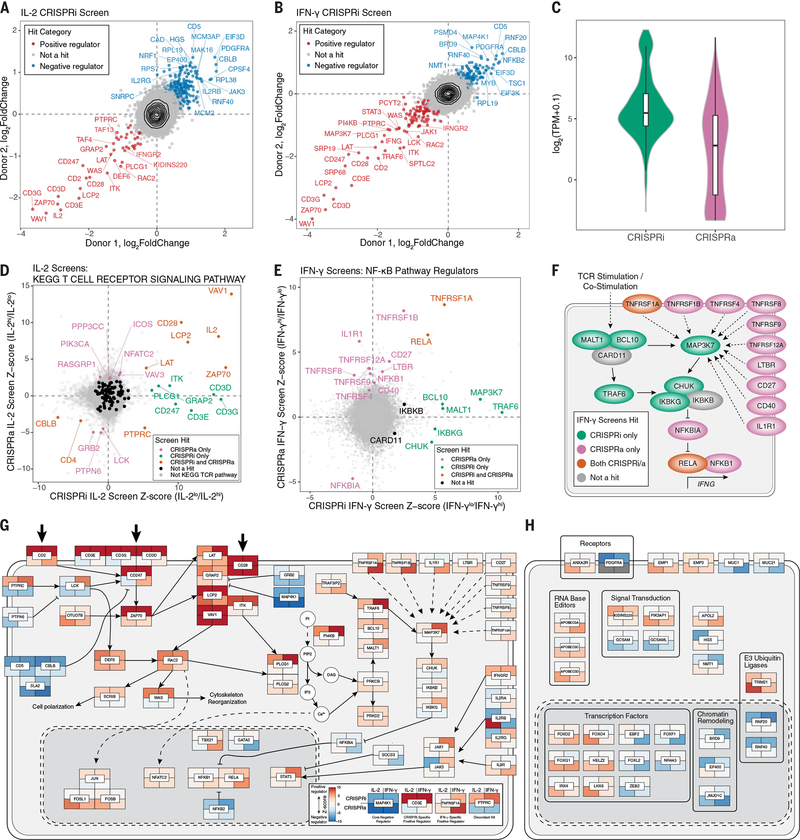
Fig. 2. Integrated CRISPRa and CRISPRi screens mapping the genetic circuits underlying T cell cytokine response in high resolution.
(A and B) Median sgRNA log2-fold change (high/low sorting bins) for each gene, comparing CRISPRi screens in two donors, for IL-2 (A) and IFN-γ (B) screens. (C) Distributions of gene mRNA expression for CRISPRa and CRISPRi cytokine screen hits in resting CD4+ T cells (this study). (D) Comparison of IL-2 CRISPRi and CRISPRa screens with genes belonging to the TCR signaling pathway (KEGG pathways) indicated in colors other than gray. (E) Comparison of IFN-γ CRISPRi and CRISPRa screens with manually selected NF-κB pathway regulators labeled. All other genes are shown in gray. (F) Map of NF-κB pathway regulators labeled in (D). (G) Map of screen hits with previous evidence of defined function in T cell stimulation and costimulation signal transduction pathways. Genes shown are significant hits in at least one screen and were selected based on review of the literature and pathway databases (e.g., KEGG and Reactome). Tiles represent proteins encoded by indicated genes with the caveat that, because of space constraints, subcellular localization is inaccurate because many of the components shown in the cytoplasm occur at the plasma membrane. Tiles are colored according to log2-fold change Z score, as shown in the subpanel, with examples of different hits. Large arrows at the top represent stimulation/costimulation sources. (H) Select screen hits with less well-described functions in T cells in the same format as (G). For (H), only significant hits from the top 20 positive and negative ranked genes by log2-fold change for each screen were candidates for inclusion.

