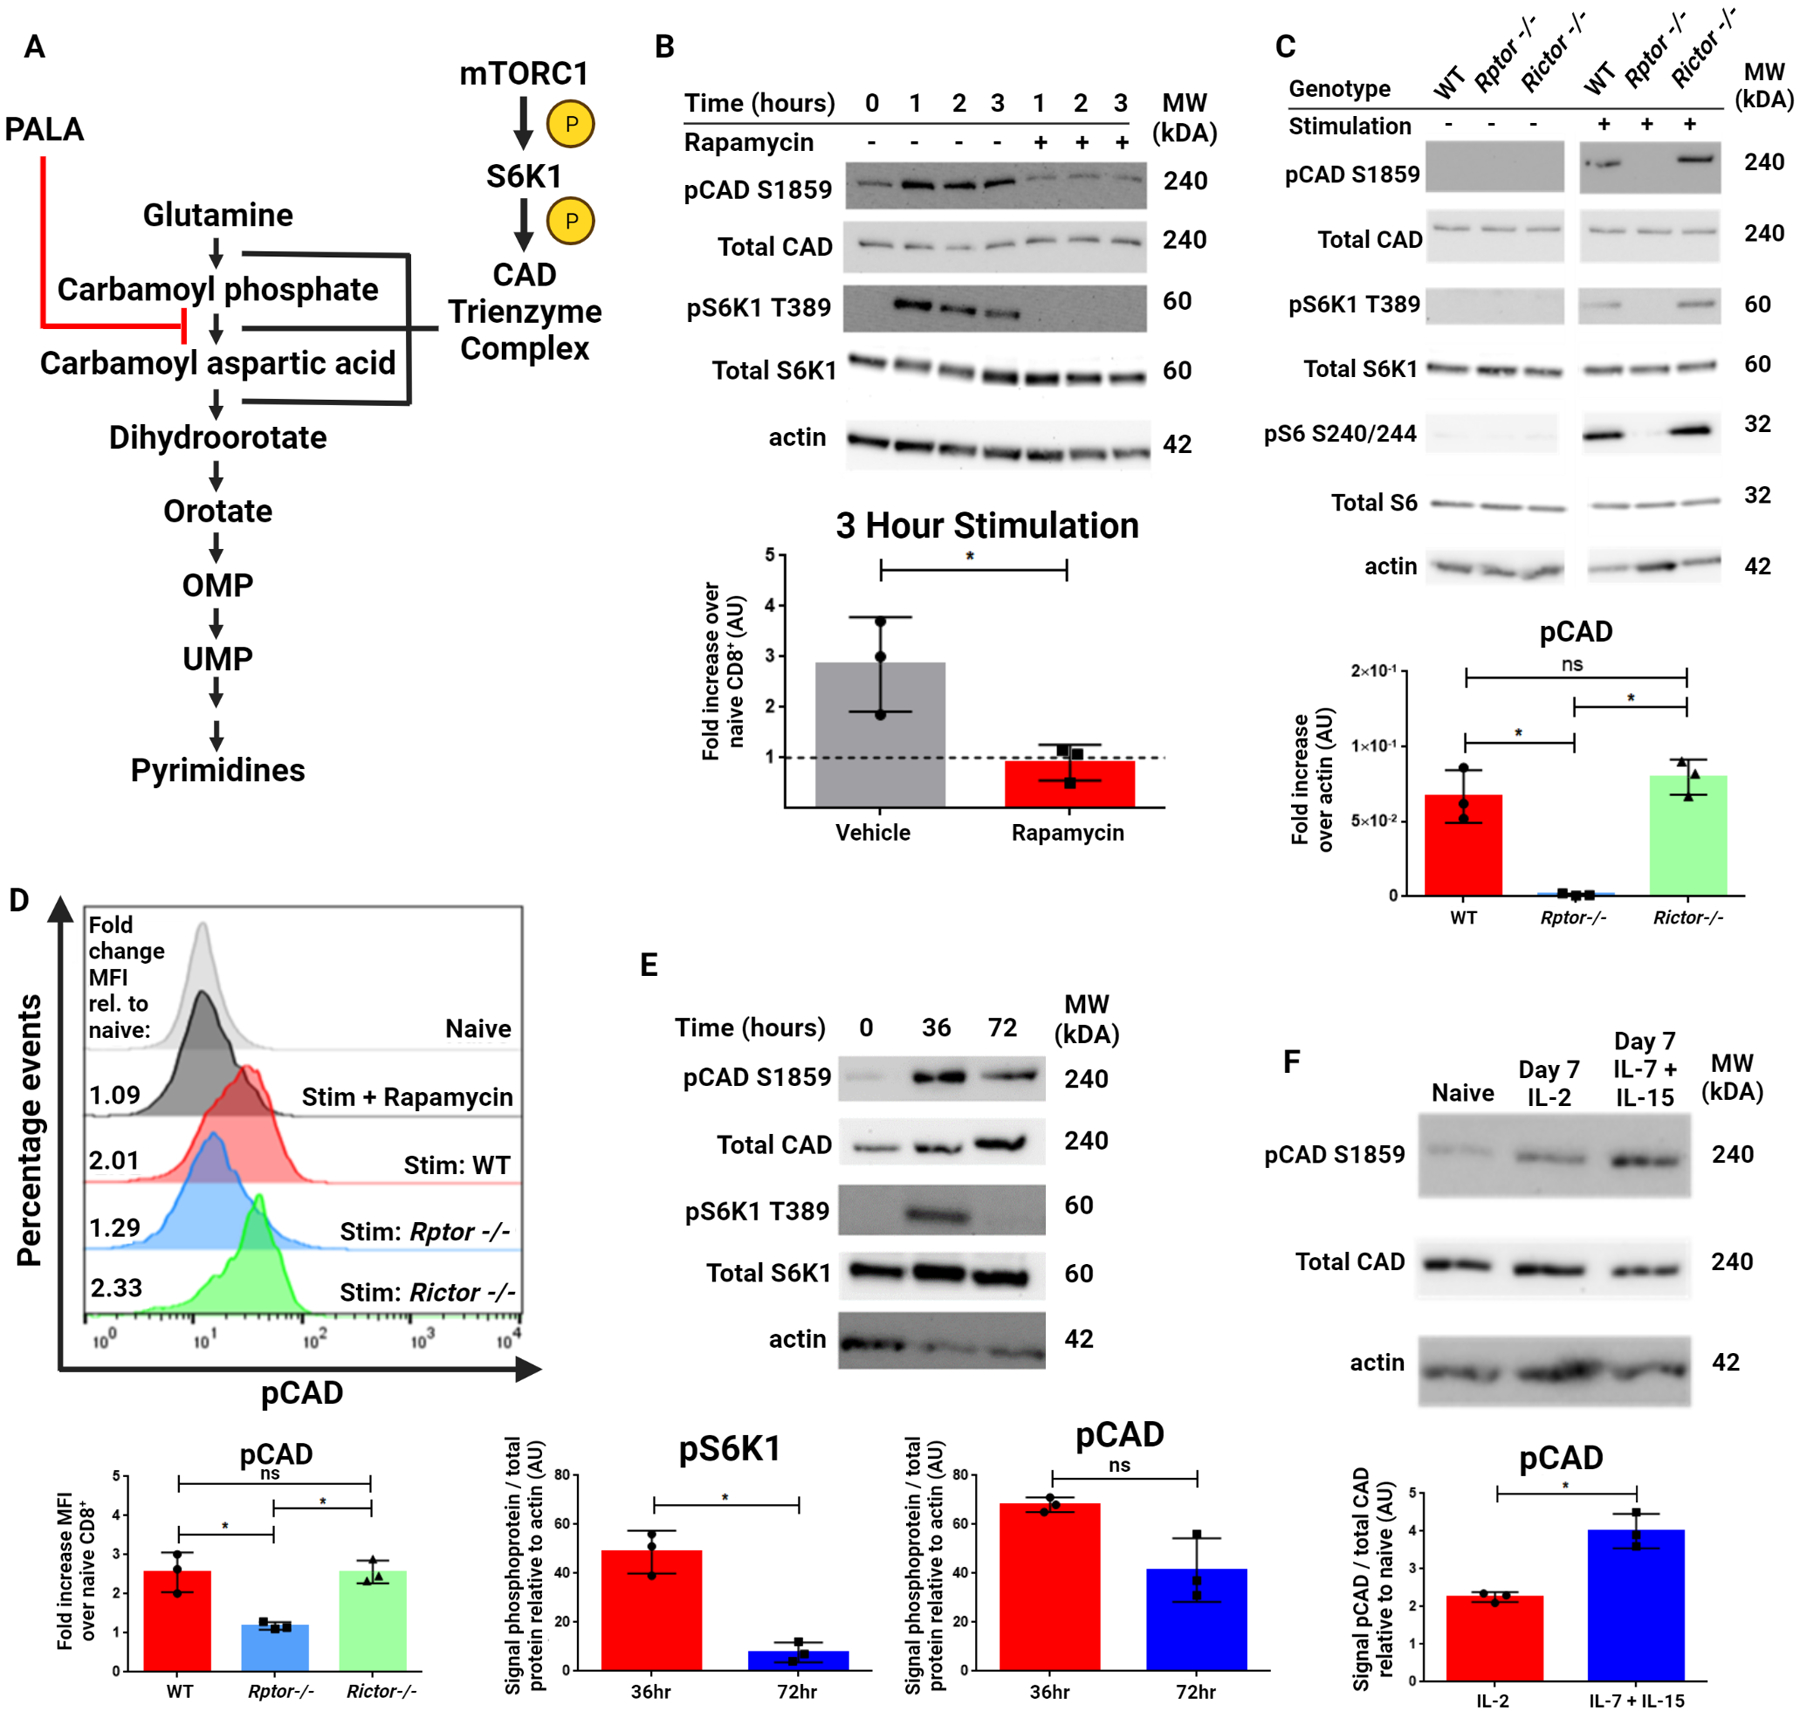
Figure 1: mTORC1-dependent phosphorylation of CAD at S1859 persists beyond T cell activation.

(A) The de novo pyrimidine synthesis pathway. The rate-limiting trifunctional enzyme CAD is phosphorylated and activated by S6K1, which is in turn phosphorylated and activated by mTORC1. The CAD protein catalyzes the first three steps of this pathway and is inhibited by the small molecule PALA (shown in red). (B) Western blot analysis of CD8+ T cells isolated from spleens of naïve WT mice and stimulated with anti-CD3/28 antibodies for indicated time periods with or without rapamycin (100 nM). (C) Western blot analysis of CD8+ T cells isolated from spleens of naïve WT, Rptor−/− and Rictor−/− mice stimulated with anti-CD3/28 antibodies for indicated three hours. (D) Flow cytometric analysis of WT, Rptor−/− and Rictor−/− mice for pCAD. CD8+ T cells from WT mice were analyzed as either unstimulated (grey) or stimulated using anti-CD3/28 antibodies for three hours with 100 nM rapamycin (black) or without rapamycin (red). Rptor−/− (blue) and Rictor−/− (green) CD8+ T cells were also stimulated for three hours. (E) Western blot analysis of CD8+ T cells isolated from spleens of naïve WT mice and stimulated with anti-CD3/28 antibodies for 36 and 72 hours. (F) Western blot analysis of CD8+ T cells isolated from spleens of naïve C57BL/6J mice and stimulated with anti-CD3/28 antibodies for 48 hours, then expanded in media containing IL-2 or IL-7 + IL-15 for an additional five days. Data in (B) includes representative image and densitometry of fold increase in signal relative to actin across three experiments. Data in (C) includes representative image and densitometry of signal relative to actin across three experiments. Data in (D) included representative image and depicts fold change in MFI over naïve CD8+cells across three experiments. Data in (E) and (F) include representative image and densitometry of signal ratio of phosphoprotein to total protein relative to actin across three experiments. Data in (B), (E), and (F) analyzed by two-tailed t test. Data in (C) and (D) analyzed by one-way ANOVA followed by Tukey’s HSD test. *P <0.05, ns = not significant.
