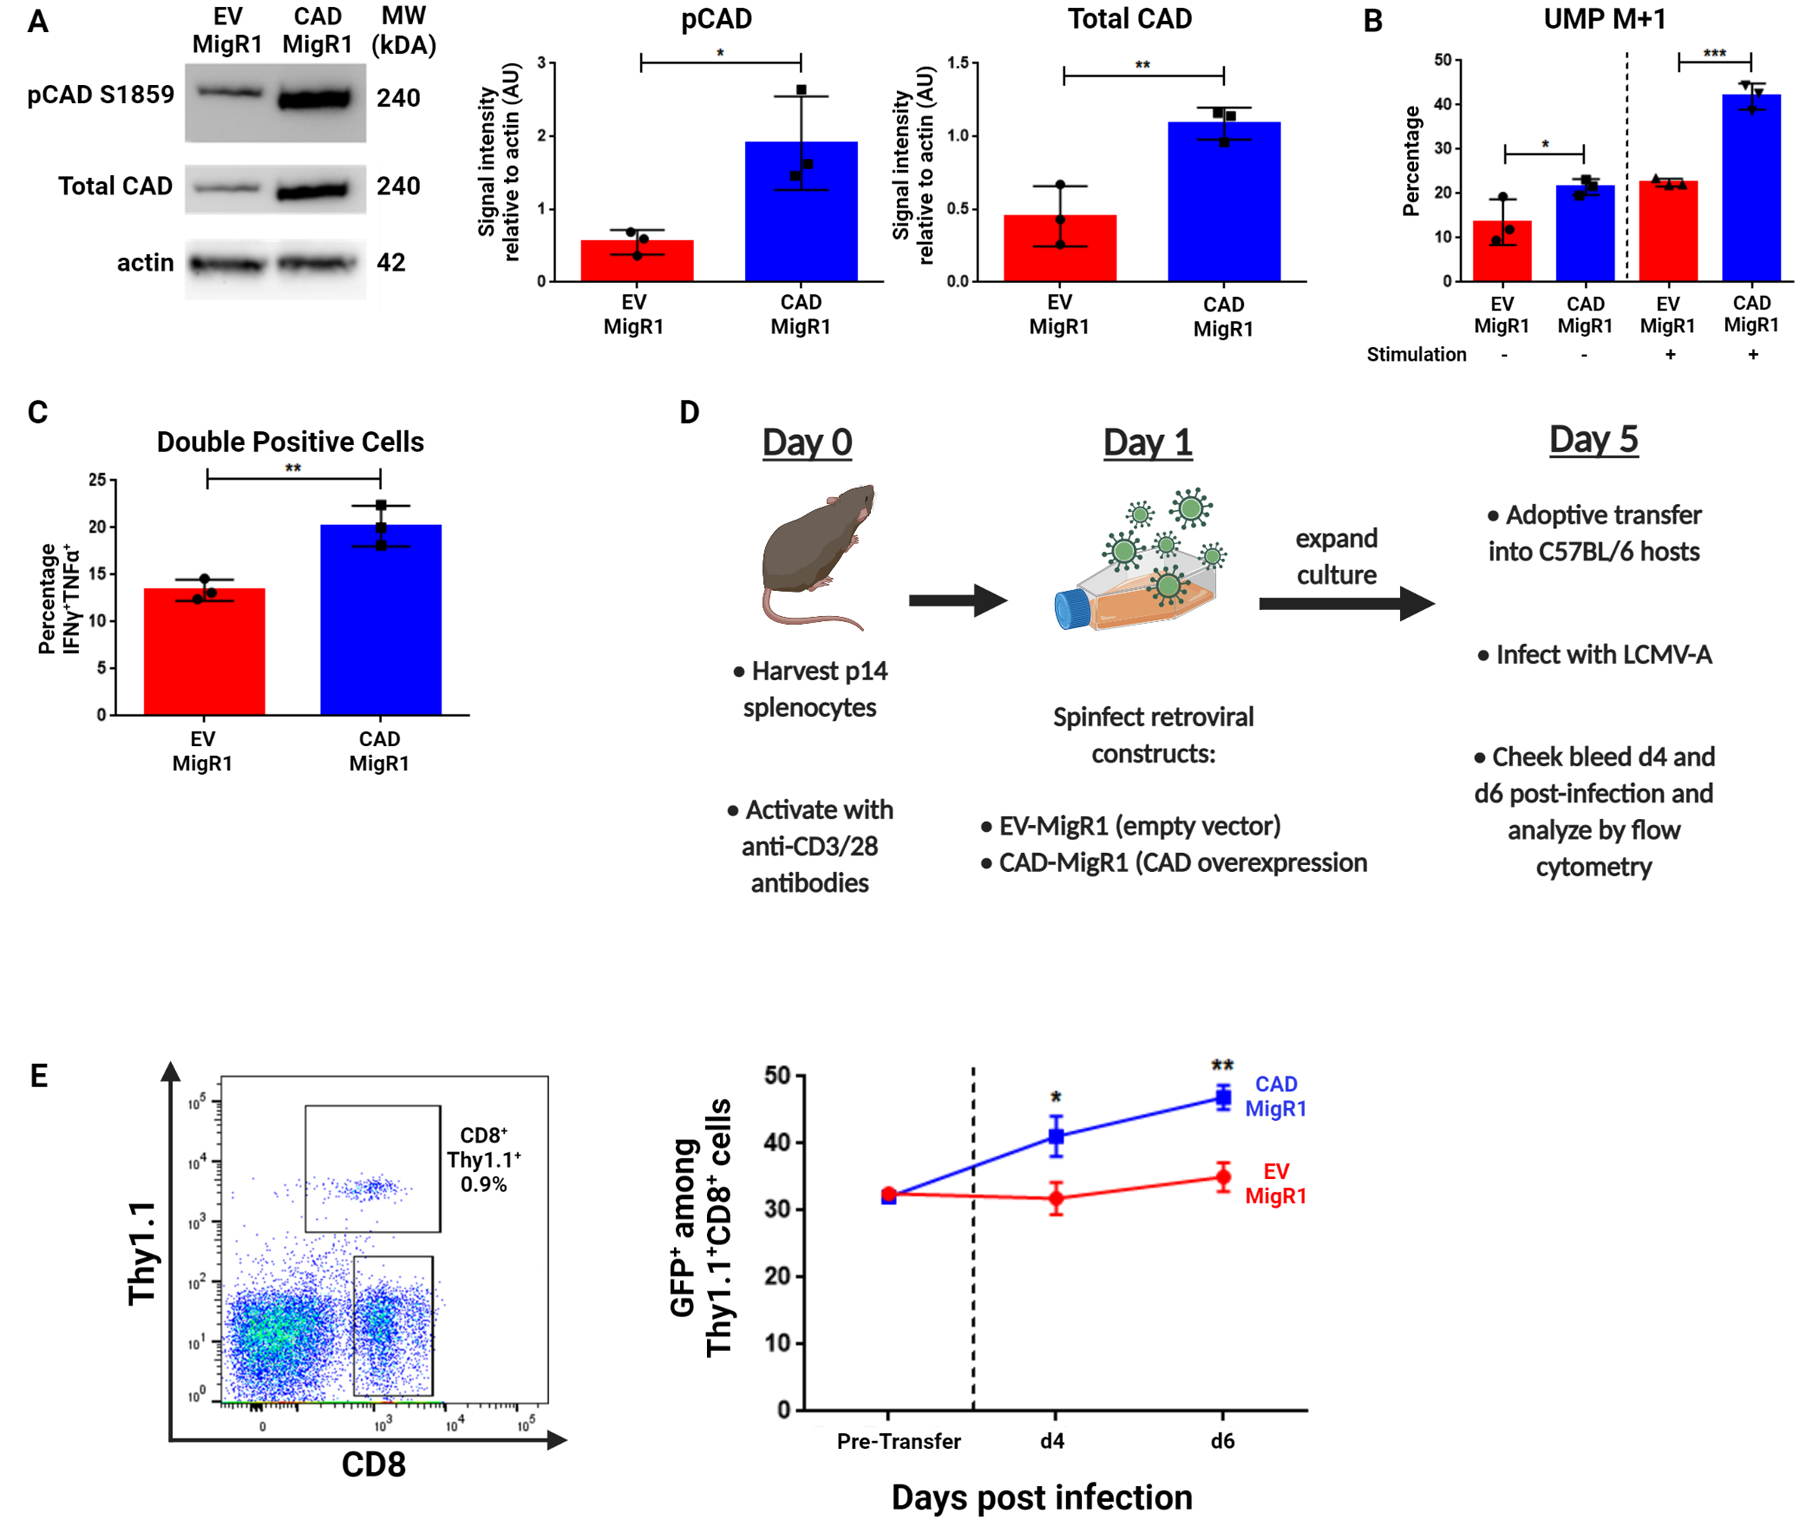
Figure 5: CAD overexpression improves recall response in CD8+ T cells.

(A-C) CD8+ cells isolated from WT mice were stimulated with anti-CD3/28 antibodies for 24 hours before introduction of indicated retroviral constructs with cells analyzed on Day 6 of culture. (A) Western blot analysis of pCAD (S1859) and total CAD levels in CD8+ cells following retroviral transduction with EV-MigR1 or CAD-MigR1 constructs. (B) Percentage M+1 peak data for de novo pyrimidine synthesis metabolites measured by LC/MS between EV-MigR1 and CAD-MigR1 cells. On Day 6 of culture, freshly-isolated naïve, EV-MigR1 and CAD-MigR1-transduced cells were rested in culture media before transfer to glutamine-free media supplemented with 4 mM amide-labeled 15-N glutamine, with a portion of each condition stimulated with anti-CD3/28 antibodies. (C) Summary data of cytokine response of retrovirally-transduced cells across three experiments generated as in (B) following 4 hours stimulation with PMA/ionomycin. Data gated on live CD8+GFP+ cells with percentage IFNγ+TNFα+ cells reported. (D) Schematic of adoptive transfer experiments with previously activated P14 retrovirally-transduced cells. (E) Percentage GFP+ before transfer and at Day 4 and Day 6 following adoptive transfer and infection with LCMV-Armstrong. Data in (A) depict representative western blot images and densitometry quantification of indicated protein relative to actin from three independent experiments analyzed by two-tailed t test. Data in (B) are mean ± SD of triplicate samples representative of two independent experiments analyzed by two-way ANOVA followed by Tukey’s HSD test. Data in (C) depicts percentage double positive cells across three independent experiments analyzed by two-tailed t test. Data in (E) depict representative gating strategies and GFP+ ± SD analyzed with two-tailed t test at each indicated time point (n=5 mice per condition). *P <0.05, **P<0.01, ***P<0.001.
