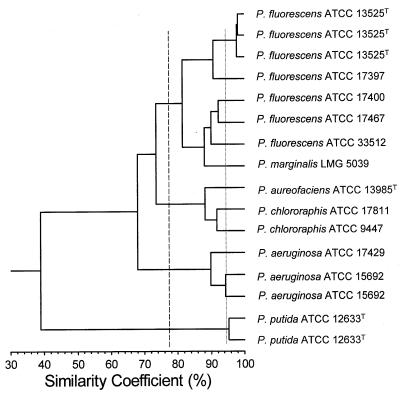
FIG. 4.
Similarity dendrogram (UPGMA) of microarray hybridization profiles of fluorescent Pseudomonas strains. The solid line indicates a cutoff value at which all different strains tested were resolved. The dashed line indicates species-level resolution that corresponds to 70% whole-genome DNA hybridization.

