
Table 3.
Structure and activities of C series compounds. 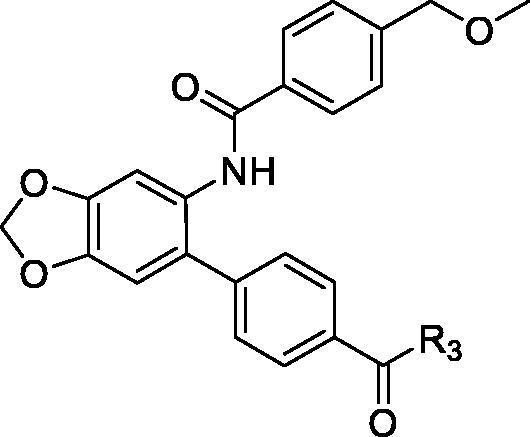
| Componds | R3 | PCSK9a | HepG2a |
|---|---|---|---|
| C1 |

|
21.6 ± 1.67 | 6.21 ± 0.22 |
| C2 |

|
17.8 ± 1.24 | 13.52 ± 1.13 |
| C3 |

|
25.3 ± 2.11 | 6.62 ± 0.45 |
| C4 |

|
7.55 ± 0.71 | 6.77 ± 0.62 |
| C5 |

|
5.92 ± 0.32 | 5.63 ± 0.37 |
| C6 |

|
3.39 ± 1.67 | 6.15 ± 0.26 |
| C7 |

|
33.4 ± 1.52 | 12.85 ± 1.07 |
| C8 |

|
25.7 ± 1.20 | 14.54 ± 1.22 |
| C9 |

|
3.75 ± 0.33 | 6.22 ± 0.24 |
| C10 |

|
5.48 ± 0.20 | 6.76 ± 0.18 |
| PCSK9 neutralising antibody | – | IC50 = 7.8 nM | ND |
| SAHA | – | ND | 89.2 ± 1.76 |
a
Illustrated as percentage inhibitory rate at concentration of 10 µM, and each value is the mean of three experiments. ND: Not determined.