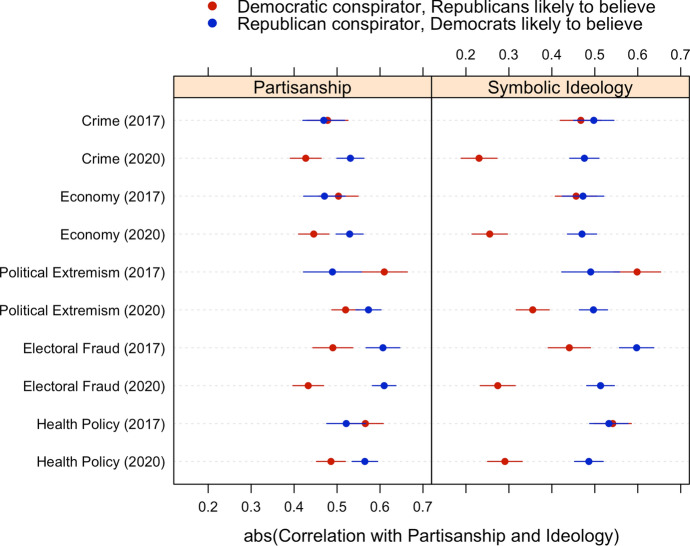
Fig. 3.
Pearson’s correlations between beliefs in specific content-controlled conspiracy theories and partisan and ideological self-identification. Horizontal bands represent 95% confidence intervals, two-tailed tests. Data from the following surveys: Lucid February 2020 (nRepublican Conspirator = 2,009; nDemocratic Conspirator = 1,985), MTurk October 2017 (nRepublican Conspirator = 992; nDemocratic Conspirator = 1,023). See online appendix for sample characteristics

