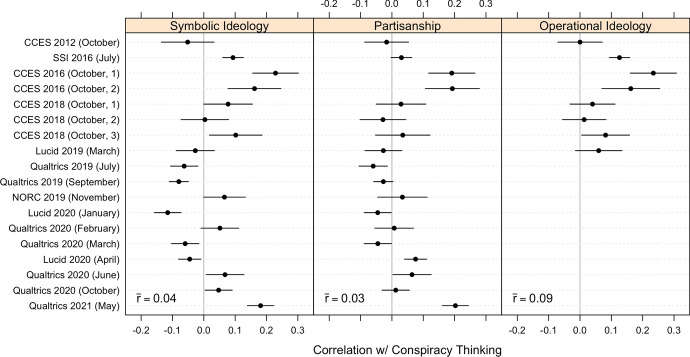
Fig. 5.
Pearson’s correlations between conspiracy thinking scale and partisanship, symbolic ideology, and operational ideology across studies and time. Horizontal bands represent 95% confidence intervals, two-tailed tests. Data sources listed along vertical axis. Individual sample sizes and sample characteristics appear in the appendix

