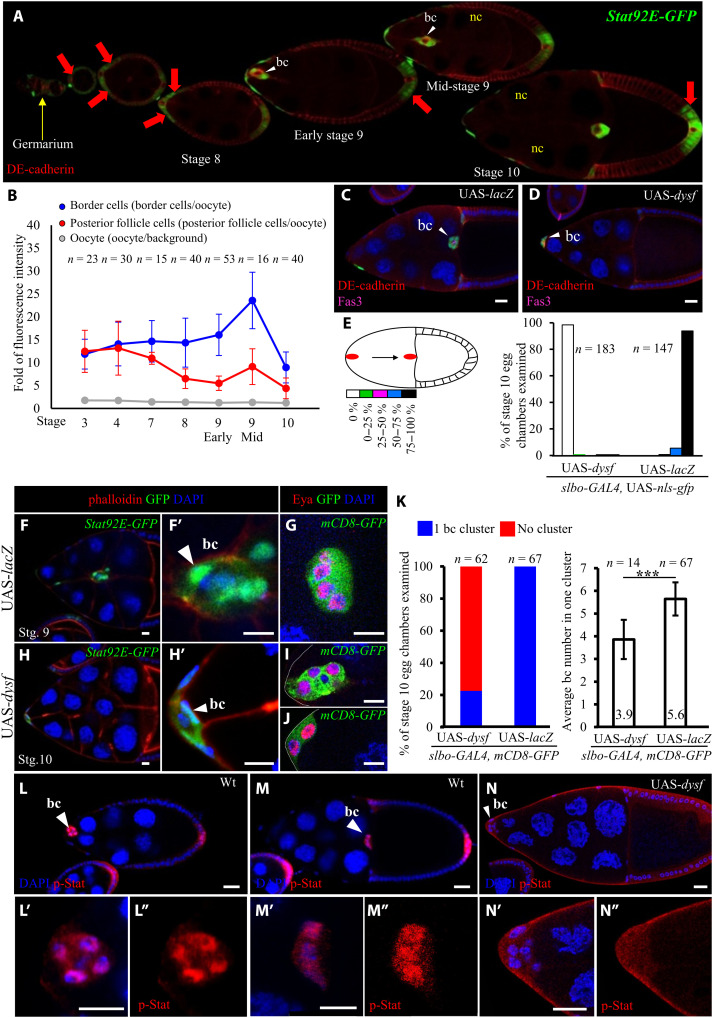
Fig. 1. Dysf represses Jak/Stat signaling during Drosophila oogenesis.
Confocal micrographs of Drosophila egg chambers showing border cells (bc; arrowheads) migrating through nurse cells (nc). Anti–DE-cadherin staining [red in (A), (C), and (D)] labels cell margins, and DAPI (4′,6-diamidino-2-phenylindole; blue) marks nuclei. All UAS transgenes were driven by slbo-GAL4. (A) The Stat92E-GFP reporter (green) reveals Stat activity during Drosophila oogenesis from the germarium (yellow arrow) to egg chambers (red arrow). (B) Fluorescence intensity of Stat92E-GFP in Drosophila oogenesis. (C and D) Dysf overexpression impairs border cell migration. Fasciclin 3 (Fas3; magenta) staining labels polar cells. (E) Quantification of migration defect caused by dysf overexpression. The migration path is divided into five sections to quantify the extent of border cell migration. (F and H) Dysf overexpression reduced border cell number in the cluster. Stat92E-GFP signal marks border cells (white arrowheads), and phalloidin staining (red) labels cell margins. (G, I, and J) slbo-GAL4>UAS-mCD8gfp marks the cluster morphology, and anti-Eya labels anterior follicle cells. (K) Quantification of Dysf effect on border cells. (L and M) Anti–p-Stat staining (red) displays nuclear accumulation in border cells. Wt, wild type. (N) Dysf overexpression reduced p-Stat accumulation in border cell nuclei. n represents the number of egg chambers examined; ***P < 0.001, two-tailed t test. Error bars indicate SD. Scale bars, 20 μm.

