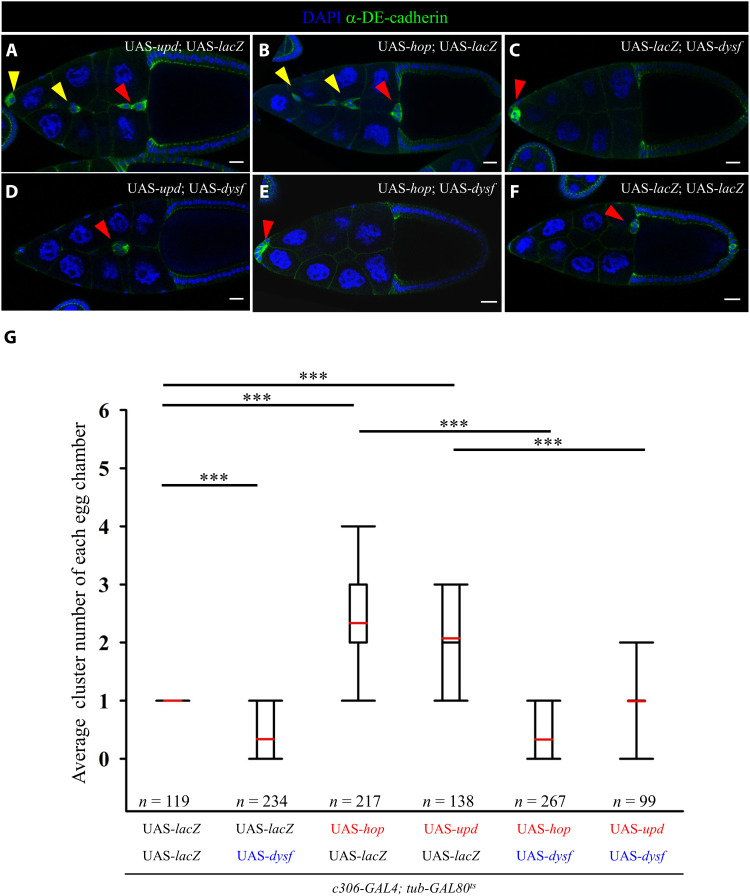
Fig. 2. Dysf suppresses the hyperactive Jak/Stat phenotype in border cells.
(A to F) Confocal micrographs showing border cell clusters (red arrowheads) in stage 10 egg chambers of the indicated genotypes. Anti–DE-cadherin staining (green) and DAPI (blue) mark cell margins and nuclei, respectively. Overexpression of upd or hop induces extra border cell clusters (A and B, yellow arrowheads). Egg chambers coexpressing dysf with upd or hop have one border cell cluster displaying migration delay (D and E), similar to the phenotype arising from dysf expression (C). Double UAS-lacZ serves as the control (F). (G) Quantitative assessment of the number of migrating clusters with indicated genotypes. n represents the total number of egg chambers examined; ***P < 0.001, two-tailed t test. The box plot shows the medians (black lines), means (red lines), the 25th and 75th range (boxes), and the 5th and 95th percentiles (whiskers). Scale bars, 20 μm.

