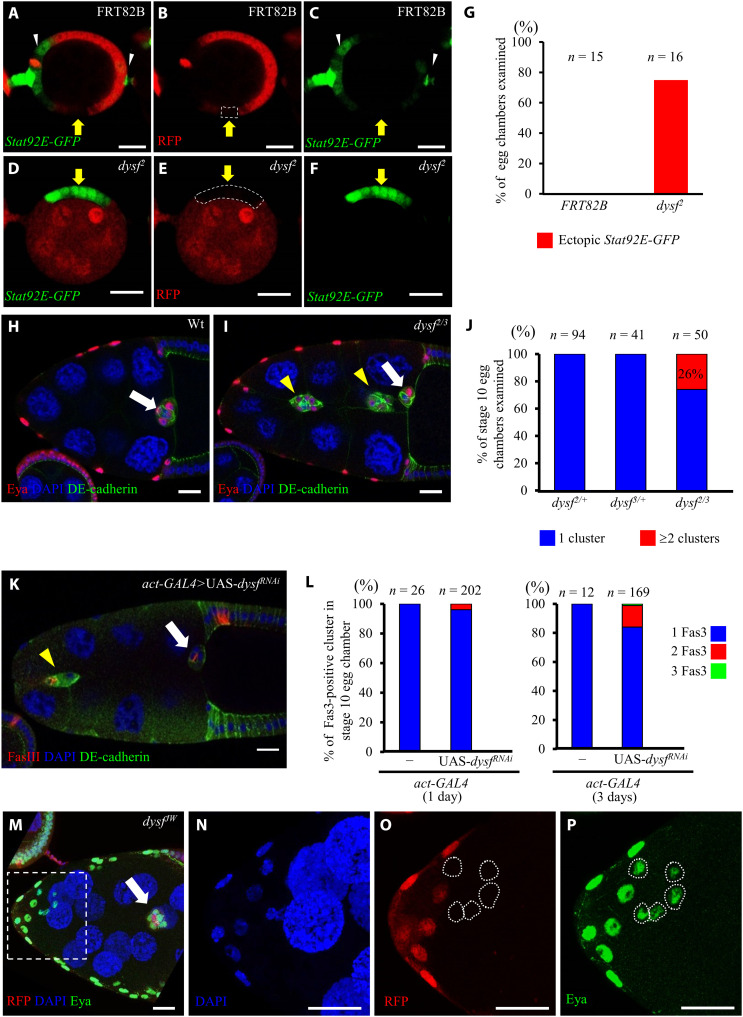
Fig. 3. Down-regulation of dysf results in recruitment of extra border cells.
(A to C) Immunofluorescence micrographs showing Stat92E-GFP (green) expression patterns in egg chambers. White arrowheads indicate egg chamber terminals. (D to F) The dysf2 mutant clone [red fluorescence protein (RFP)–negative; dotted circle] presents ectopic Stat92E-GFP signal (yellow arrows) relative to control clones [yellow arrows in (A) to (C)]. (G) Quantification of ectopic Stat92E-GFP in indicated genotypes. (H and I) dysf2/3 displays multiple border cell clusters (yellow arrowheads). (J) Quantification of extra border cells in dysf2/3. (K) Knocking down dysf induced extra border cell clusters (yellow arrowheads). Anti-FasIII labels polar cells. (L) Quantification of ectopic cluster formation by dysf RNAi knockdown. Colors indicate the border cell cluster number. (M to P) Three-dimensional projection exhibits freely migrating border cells (white arrow) under dysfJW mutation (RFP-negative; white outline). All white arrows indicate border cells reaching the oocyte border. Enlargements of the boxed region are shown in (N) to (P). Anti-Eya stains follicle cells and border cells [red in (H) and (I); green in (M) and (P)]. DE-cadherin staining (green) labels cell margins (H, I, and K). DAPI (blue) marks all nuclei. Scale bars, 20 μm.

