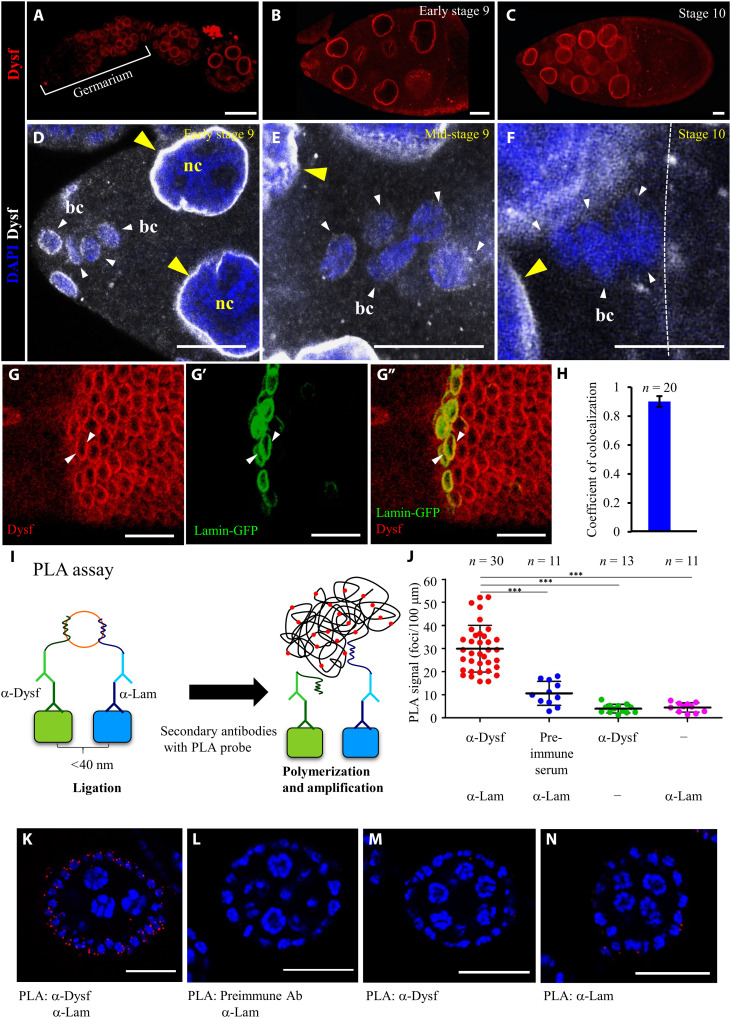
Fig. 4. The nuclear membrane of border cells displays a gradual decline in Dysf expression.
(A to G) Immunofluorescence micrographs showing anti-Dysf staining during Drosophila oogenesis [red in (A) to (C), (G), and (G″); white in (D) to (F)]. Arrowheads indicate nuclear membrane staining of Dysf in border cells (white) and nurse cells (yellow) in early stage 9 (D), mid-stage 9 (E), and stage 10 (F) egg chambers. The dotted white line denotes the oocyte border. (G to G″) Colocalization of anti-Dysf staining (red) and Lamin-GFP (green) signals on nuclear membrane in main-body follicles (arrowheads). (H) Colocalization coefficient for Dysf and Lamin-GFP. n indicates the number of nuclei examined. (I) Schematic illustrating detection of the Dysf-Lamin interaction by proximity ligation assay (PLA). (J) Quantifications of PLA signals using the indicated antibodies. The line boundaries show the SD of signal distributions, with the midline marking the average. (K to N) Confocal micrographs of egg chambers showing PLA reactions (red) with indicated antibodies. DAPI (blue) labels nuclei. n represents total sample size; ***P < 0.001, two-tailed t test. Error bars indicate SD. Scale bars, 25 μm (A to F) and 20 μm (G and K to N).

