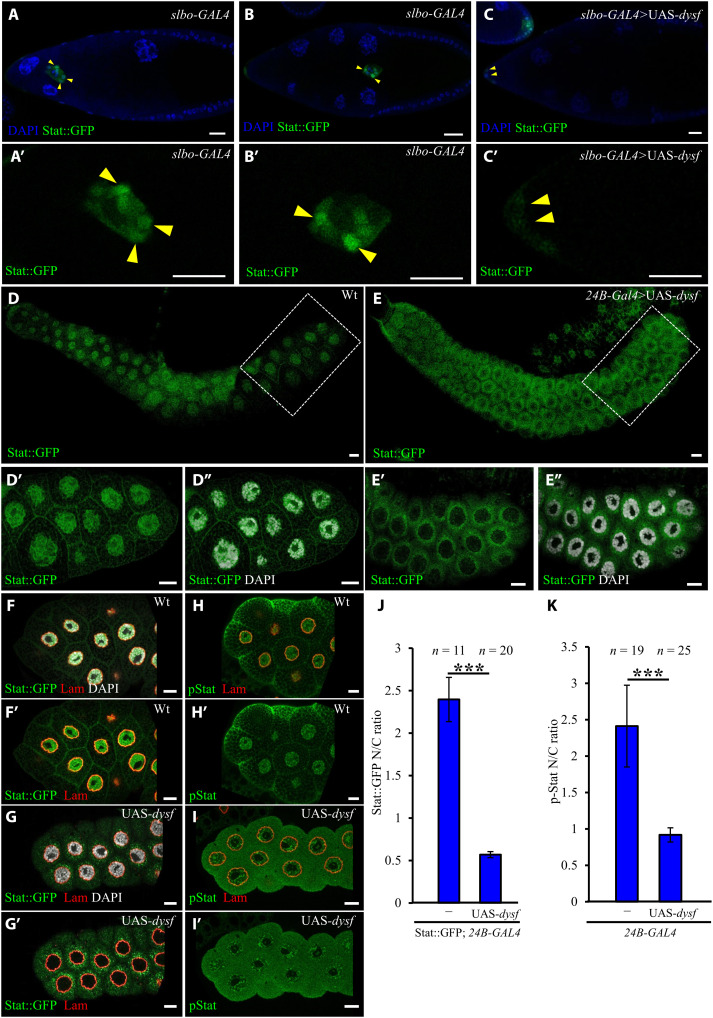
Fig. 5. Suppression of Stat nuclear import upon Dysf overexpression.
(A to C) Confocal images of GFP-tagged Stat distribution (green) in stage 9 or 10 egg chambers stained with DAPI (blue) to mark nuclei. Border cells indicated by arrowheads are shown below at higher magnification (A′ to C′). Stat::GFP expression (green) (D to G) and anti–p-Stat staining (H and I) in the salivary glands of the indicated genotypes, as revealed by immunofluorescence staining, and boxed regions are enlarged and displayed below. DAPI labels nuclei (white), and anti-Lamin (red) staining defines the boundary between the nucleus and cytoplasm. Quantitative assessment of the impact of Dysf on Stat nuclear localization by examining the nucleus:cytoplasm ratio of Stat::GFP (J) or anti–p-Stat (K) fluorescence signal. n indicates the number of salivary glands examined; ***P < 0.001, two-tailed t test. Error bars indicate SD. Scale bars, 20 μm.

