. 2022 Jul 6;11:e67464. doi: 10.7554/eLife.67464

Figure 1. Biophysical properties of Cav2.3 channels co-transfected with different β-subunits (and α2δ1) in tsA-201 cells.

(A) Current densities (pA/pF) with or without (gray) co-transfection of indicated β-subunits. Color code and n-numbers are given in the graphs. (B) Voltage-dependence of steady-state activation (normalized conductance G, right axis, solid lines) and inactivation (normalized ICa of test pulses, left axis, dashed lines, left n-numbers in parentheses). (C) Inactivation time course during 5 s depolarizing pulses to Vmax starting from a holding potential of –119 mV. Inset shows the first 200 ms of the 5 s pulse. Respective stimulation protocols are shown above each graph. The curves represent the means ± SEM for the indicated number of experiments (N = β2a: 5; β2d, β2e: 2; β3, β4, no β: 3). For statistics see Table 1. Vmax, voltage of maximal inward current. (D) Window currents measured in the presence of the indicated β-subunits were calculated by multiplying mean current densities (pA/pF) of I-V-relationships by the fractional current inactivation from steady-state inactivation curves at the indicated voltages. Data represent the means ± SEM for the indicated number of experiments (N = β2a: 5; β2d, β2e: 2; β3, β4: 3). Statistical significance was determined using one-way ANOVA with Bonferroni post-hoc test and is indicated: *** p<0.001; ** p<0.01; * p<0.05. Source data provided in Figure 1—source data 1.

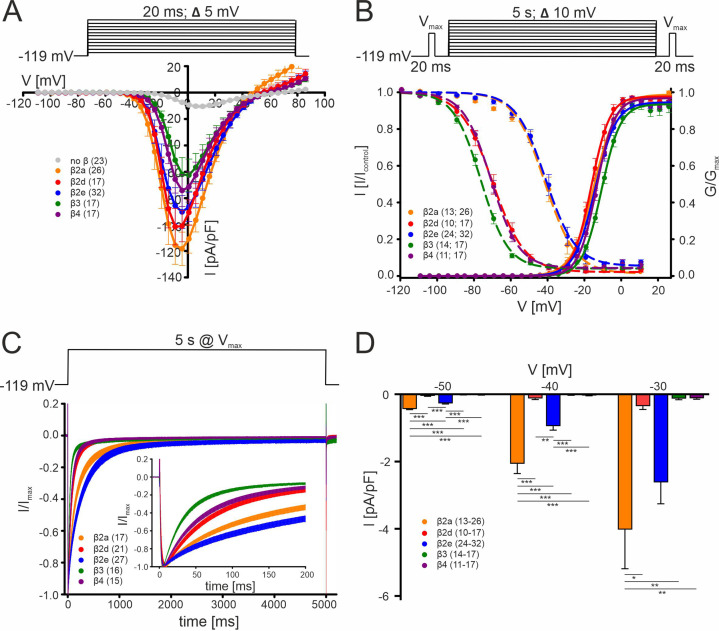
Figure 1—source data 1. Source data for data shown in Figure 1.

Figure 1.

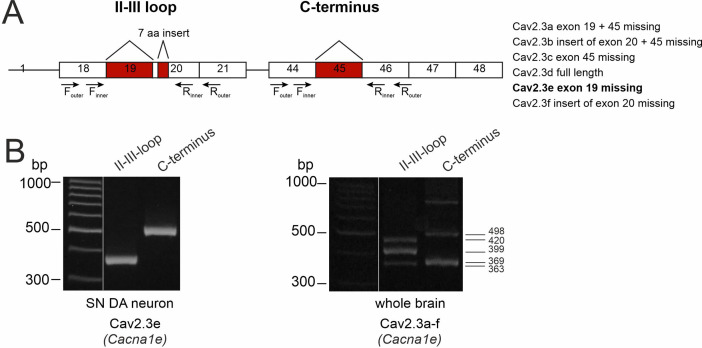
Figure 1—figure supplement 1. Determination of the expressed Cav2.3 splice variants in SN DA neurons.

Figure 1—figure supplement 1.

(A) Cartoon of the exon structure of all Cav2.3 splice variants. The murine Cacna1e gene, coding for the Cav2.3 α1-subunits contains 48 exons with six major alternative splice variants (right panel). The splicing events include the variable use of exon 19, 21 nucleotides of exon 20 and exon 45. The outer and inner primer pairs chosen for identification of the different splice variants are located in the II-III loop and the C-terminus, covering the three described splicing sites. Expressed exons are shown as white boxes and splicing sites are indicated in red. (B). Agarose gel electrophoresis image showing two PCR products (363 bp II-III loop nested PCR fragment and 498 bp C-terminus nested PCR fragment) coding for the Cav2.3e splice variant of Cav2.3 (Cacna1e) found in mouse laser-dissected SN DA neuron derived cDNA (n=40, left). In contrast, all five PCR products (363 bp, 399 bp, and 420 bp in the II-III loop and 369 bp and 498 bp in the C-terminus nested PCR fragments) coding for all six major splice variants were found in whole brain tissue-derived cDNA (as positive control, right panel).

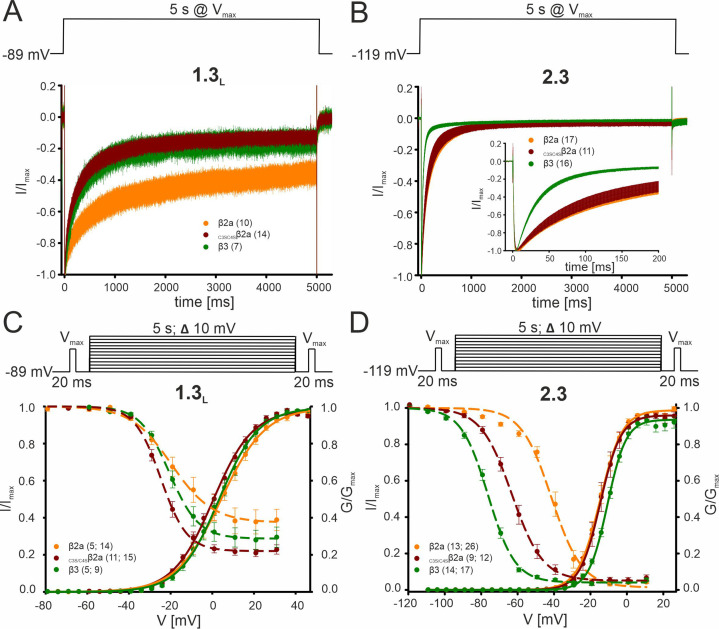
Figure 1—figure supplement 2. Effect of β2a palmitoylation on the biophysical properties of Cav2.3 and Cav1.3 Ca2+ channels in tsA-201 cells.

Figure 1—figure supplement 2.

Since palmitoylation is reversible and regulated in an activity-dependent localized manner (Bijlmakers and Marsh, 2003; Matt et al., 2019), we also investigated the contribution of palmitoylation of β2a for Cav2.3e modulation under our experimental conditions. To mimic the de-palmitoylated form, we replaced the two N-terminal cysteines to serines (C3S/C4Sβ2a) which prevents plasma membrane anchoring of β2a (Gebhart et al., 2010; Qin et al., 1998). Data are shown for Cav1.3 (C-terminally long splice variant, Bock et al., 2011) or Cav2.3 α1-subunits co-expressed with α2δ1 and β2a (orange), C3S/C4Sβ2a (red) or β3 (green). Respective command voltages are given in each panel. To disrupt palmitoylation-mediated membrane anchoring, the two N-terminal cysteines of β2a (see Figure 2—figure supplement 1) were replaced by serines in C3S/C4Sβ2a. (A, B) Inactivation kinetics during a 5 s long depolarizing step to Vmax for Cav1.3L (A), 15 mM Ca2+, holding potential –89 mV or Cav2.3 (B), 2 mM Ca2+, holding potential –119 mV. Curves represent means ± SEM for the indicated number of experiments. For statistics see Table 1 and Supplementary file 6. (C, D) Voltage-dependence of activation (solid lines, normalized conductance G) and inactivation (dashed lines, normalized ICa of 20-ms test pulses) for Cav1.3L (C) 15 mM Ca2+, holding potential –89 mV or Cav2.3 (D), 2 mM Ca2+, holding potential –119 mV. Means ± SEM. For statistics see Table 1 and Supplementary file 6. C3S/C4Sβ2a significantly shifted V0.5,inact of Cav2.3 to more positive voltages as compared to β3 but to a much smaller extent (<14 mV) than β2a (+35 mV) (Table 1). Due to this prominent role of palmitoylation on the V0.5,inact of Cav2.3 channels, the palmitoylation state of β2a should allow further fine-tuning of non-inactivating current components of Cav2.3 channels in SN DA neurons. The effects of β2a palmitoylation on the inactivation kinetics and inactivation voltage of Cav1.3 L-type channels (A, C) were different from Cav2.3, suggesting that palmitoylation/depalmitoylation events would regulate Ca2+ channel function in a subtype-selective manner. Unlike β2a, C3S/C4Sβ2a was unable to slow the inactivation time course of Cav1.3, thus stabilizing faster inactivation similar to β3 (Supplementary file 6, Gebhart et al., 2010). In contrast, preventing palmitoylation of β2a did not affect the inactivation time course of Cav2.3e (Table 1). Moreover, unlike observed for Cav2.3, steady-state inactivation was not significantly different for Cav1.3 co-transfected with β2a, β3, or C3S/C4Sβ2a (Supplementary file 6). Source data provided in Figure 1—figure supplement 2—source data 1.
Figure 1—figure supplement 2—source data 1. Source data for data shown in Figure 1—figure supplement 2.