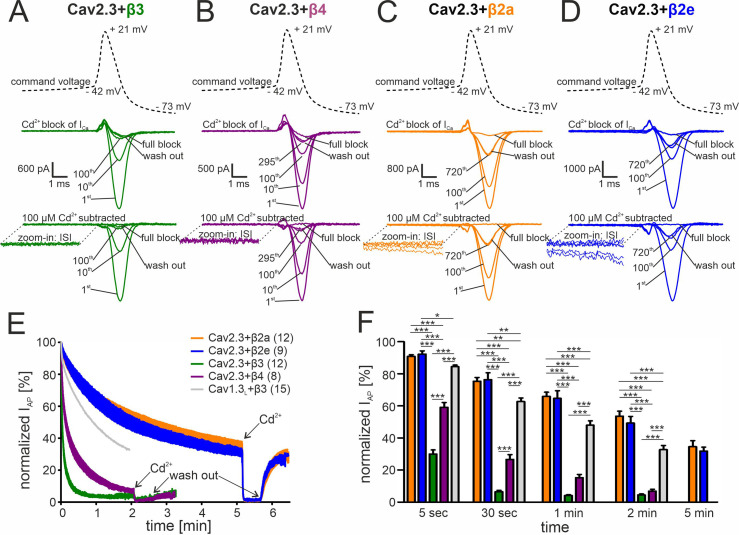
Figure 3. Activity-dependent inactivation of Cav2.3 channels co-transfected with different β subunits (and α2δ1) during simulated SN DA neuron regular pacemaking activity in tsA-201 cells.
(A–D) Top panel: The SN DA neuron-derived command voltage was applied with a frequency of 2.5 Hz (only a time interval around the AP-spike is shown). Middle panel: Corresponding representative Ca2+ current traces (2 mM charge carrier) for Cav2.3 channels co-expressed with α2δ1 and β3 (A, green), β4 (B, purple), β2a (C, orange), or β2e (D, blue) are shown for the indicated sweep number (1st, 10th, 100th, 295th, 720th). Cav2.3 currents were completely blocked by 100 μM Cadmium (Cd2+), and remaining Cd2+-insensitive current components were subtracted off-line (bottom panel). ISI, interspike interval. (E) Current decay during simulated 2.5 Hz SN DA neuron pacemaking. Normalized peak inward current during APs (IAP) is plotted against time as mean ± SEM for the indicated number of experiments. IAP amplitudes were normalized to the IAP amplitude of the first AP after holding the cell at –89 mV. Cav1.3L co-expressed with α2δ1 and β3 (gray, mean only) is shown for comparison (data taken from Ortner et al., 2017). The IAP decay was fitted to a bi-exponential function (Cav2.3 β3: Aslow = 39.4% ± 0.65 %, τslow = 22.2 ± 0.15 min, Afast = 54.2 ± 0.76 %, τfast = 2.86 ± 0.07 min, non-inactivating=4.47% ± 0.13%; β4: Aslow = 48.5 ± 0.26 %, τslow = 90.3 ± 1.07 min, Afast = 41.8 ± 0.40 %, τfast = 8.39 ± 0.16 min, non-inactivating=5.12% ± 0.12%; β2a: Aslow = 52.6 ± 0.47 %, τslow = 299.3 ± 10.2 min, Afast = 13.4 ± 0.53 %, τfast = 18.2 ± 1.47 min, non-inactivating=32.3% ± 0.77%; β2e: Aslow = 67.7 ± 0.11 %, τslow = 294.1 ± 1.77 min, Afast = 7.10.0±0.27 %, τfast = 16.6 ± 1.24 min, non-inactivating=25.0% ± 0.12%). Curves represent the means ± SEM for the indicated number of experiments (independent transfections, N=Cav2.3/β3: 4; Cav2.3/β4: 2; Cav2.3/β2a: 4; Cav2.3/β2e: 2; Cav1.3L/β3: 6). (F) Normalized IAP decay after predefined time points for Cav2.3 with β3, β4, β2a or β2e, and Cav1.3L (with β3). Color-code and n-numbers as in panel E. Statistical significance was determined using one-way ANOVA followed by Bonferroni post-hoc test: *** p<0.001; ** p<0.01; * p<0.05. Source data provided in Figure 3—source data 1.

