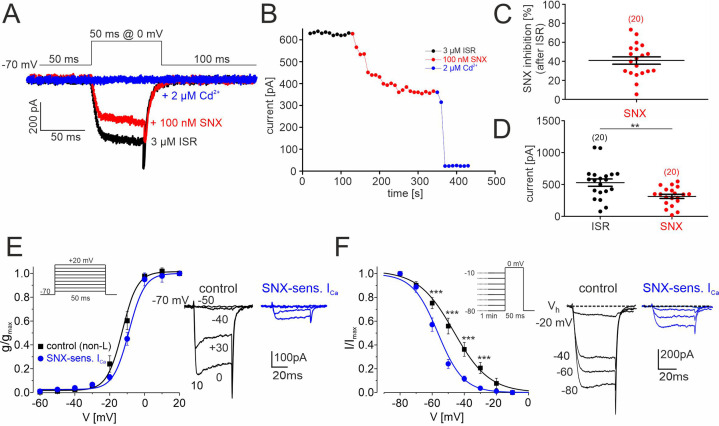
Figure 7. SNX-482–sensitive R-type currents in cultured mouse midbrain DA neurons.
(A) Representative traces illustrating the inhibition of non-L-type ICa by 100 nM SNX-482 (red). Cells were initially perfused with a bath solution containing 3 μM isradipine (black). Full block was obtained using 2 μM Cd2+ (blue). Square pulses (50 ms) were applied to 0 mV from a holding potential of –70 mV (top) (B) Current amplitude values plotted as a function of time. After stabilization of ICa with ISR (black circles), 100 nM SNX-482 was applied. The remaining currents was blocked by 2 μM Cd2+. Current run-down in the absence of drugs during 150 s was less than 1% (0.48 ± 0.18%; n=4 cells). (C) SNX-482 inhibition expressed as % of control ICa after LTCC block using 3 μM ISR. (D) Mean current amplitude at the end of ISR application and at the end of SNX-482 application. Absolute current amplitude decreased from 529±57 pA (95% CI: 409–649) to 313±33 pA (95% CI: 245–381, n=20, p<0.01, paired Students t-test). Data represent the means ± SEM for the indicated number of experiments (N=4). Statistical significance was determined using paired Student’s t-test: *** p<0.001; **p<0.01; *p<0.05. (E) Left: Depolarizations of 50 ms were repeated every 10 s to the indicated potentials from a holding potential of –70 mV (inset). The voltage dependence of the conductance, g(V), was calculated with the equation g(V)=ICa/(V− ECa) with ECa=+65 mV for the currents recorded in the presence of 3 µM ISR (control; black squares; n=9–14 per voltage) and after subtraction of the currents insensitive to 100 nM SNX-482 (n=4–7) to yield (SNX-sensitive R-type; blue circles). Data were fitted to a Boltzman function. At each test potential (V) ICa was estimated at the peak of the current trace. Right: representative current traces recorded during pulses to −50, –40, –30 and 0 mV. (F). Left: To determine the voltage-dependence of steady-state inactivation, test pulses of 50 ms to 0 mV were preceded by 1 min prepulses to voltages from –80 to –10 mV. This stimulation protocol (inset) was better tolerated by cultured DA midbrain neurons than the classical protocol used previously with other cells (Calorio et al., 2019; Pinggera et al., 2015). SNX-sensitive R-type currents (blue) were obtained after subtraction of the currents insensitive to 100 nM SNX-482 (n=3–8 per voltage) from non-L control current (black, n=8–15). Right: representative traces recorded at 0 mV from a holding potential of −20,–40, –60, and –80 mV. Inactivation curves could be best fit to Boltzman functions with the following parameters: R-type: V0.5,inact = -58.1±0.6 mV, k=–7.1 ± 1.2 mV; control: V0.5,inact = -48.0±0.9 mV, k=-11.1 ± 1.2 mV. The R-type currents (E, F) appear smaller than expected from the data in panels B and C (30–40% of non-L-type currents). This is due to a run-down of SNX-sensitive current during the repeated depolarizations used to determine the voltage-dependence of gating. This has only minimal effects on gating parameters. When accounting for a linear run-down of 40%, the V0.5,act would shift only from –58 to –56 mV. Source data provided in Figure 7—source data 1.


