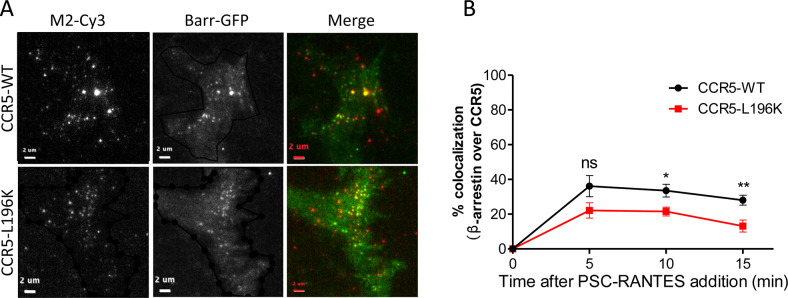
Figure 6. Dimerization through TM5 unaffects β-arrestin 2 recruitment to CCR5 but alters its trafficking.
(A, B) TIRF microscopy on FLAG-ST-CCR5-WT and FLAG-ST-CCR5-L196K cells expressing βarr2-GFP. Cells were stained with M2-Cy3 for FLAG detection and treated or not with 3 nM PSC-RANTES for the indicated times. (A) βarr2-GFP spots were detected on TIRF images from untreated cells or cells treated 10 min with PSC-RANTES. Scale bar 2 μm. (B) Quantification of the βarr2-GFP spots detected over time using ICY software and spot detector plugin (mean +/-SEM, n=at least 6 cells), Unpaired t test: p≥0.05, ns. (C) CCR5 internalization. Cell surface expression of FLAG-ST-CCR5-WT or FLAG-ST-CCR5-L196K was monitored by flow cytometry in stable HEK 293 cell clones after stimulation with a saturating concentration of PSC-RANTES (20 nM) for the indicated time. The percentage of total bound anti-FLAG antibody was calculated from the mean fluorescence intensity relative to untreated cells (mean ± SD from two independent experiments).


