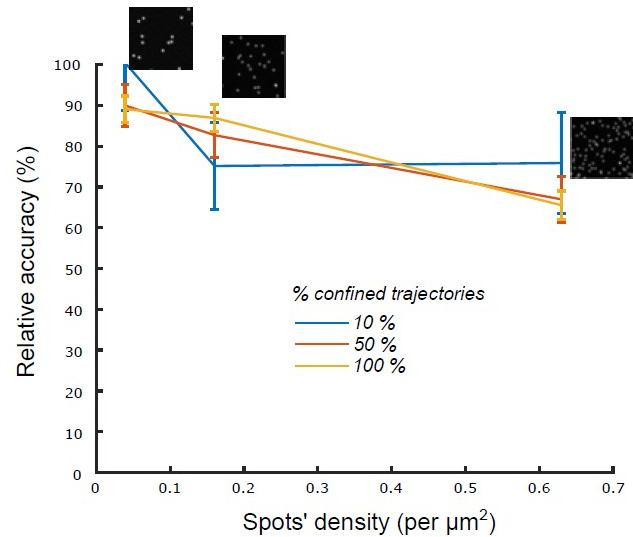
Author response image 1. Relative accuracy of statistical classification for increasing spots’ density.

The proportion of confined trajectories was set to 10% (90% Brownian, blue), 50% (50% Brownian, red) and 100% (0% Brownian, green). Confinement parameter was fixed to λ = 2. For each condition (density and proportion of confined trajectories), we run n = 10 simulations with 1000 moving spots in a 1600x1600 pixels (density = 0.039 spots/μm2), 800 X 800 pixels (density = 0.16 spots/μm2) and 400 X 400 pixels (density = 0.63 spots/μm2).
