. 2022 Jul 5;11:e77892. doi: 10.7554/eLife.77892

Figure 1. Formation and characterization of caMTOCs in AKAP450/CAMSAP2 knockout cells.

(A) Immunofluorescence images of control or centrinone-treated wild type (WT) RPE1 cells stained for centrioles (CEP135, red; centrin, green). The zooms of the boxed area show the centrioles stained with the indicated markers. (B) Quantification shows the percentage of cells with centrioles before and after the centrinone treatment. 350 cells (n=7 fields of view) analyzed for each measurement in three independent experiments. The statistical significance was determined by unpaired two-tailed Mann-Whitney test in Prism 9.1 (***p<0.001). Values represent mean ± SD. (C) Immunofluorescence images of centrinone-treated WT RPE1 cells stained for pericentrin (PCNT, green) and the Golgi marker GM130 (red). Inset shows the merged image of the boxed area. (D) Diagrams of the microtubule organization in WT and knockout (KO) cells used. (E) Immunofluorescence images of control and centrinone-treated WT and knockout RPE1 cell lines stained for pericentrin (green) and microtubules (α-tubulin, red). Enlargements on the right show the boxed areas. (F) Immunofluorescence images of centrinone-treated AKAP450/CAMSAP2 knockout RPE1 cells stained for different PCM components as indicated and imaged by STED microscopy. (G) Quantification of the length and width of cylindrical PCM clusters. n=65 cells analyzed in three independent experiments. Values represent mean ± SD. (H) (Top left) Two frames of time-lapse images of centrinone-treated AKAP450/CAMSAP2 knockout RPE1 cells stably expressing GFP-CDK5RAP2 prior to FRAP experiments. (Top right) Schemes show regions of caMTOC where photobleaching was performed. (Middle) Kymographs illustrating fluorescence of unbleached caMTOC (No FRAP), fully photobleached caMTOC (Whole FRAP) and partially photobleached caMTOC (Partial FRAP). (Bottom) Time-lapse images illustrating partial FRAP of a caMTOC. Time is min: s. (I) Normalized fluorescence intensity as a function of time. The blue line shows averaged intensity traces of unbleached caMTOCs (No FRAP), the black line shows averaged intensity traces of fully photobleached caMTOCs (Whole FRAP), the red line shows averaged intensity traces of whole caMTOC that were partially photobleached (whole caMTOC intensity, Partial FRAP) and the green line shows averaged intensity traces of the photobleached region of the partially photobleached caMTOC (FRAP region intensity, Partial FRAP). n=3 for No FRAP, 3 for Whole FRAP, 5 for Partial FRAP (whole caMTOC intensity) and 5 for Partial FRAP (FRAP region intensity); time-lapse images of ~1600 timepoints with 2 s interval were analyzed for each measurement. Values are mean ± SD.

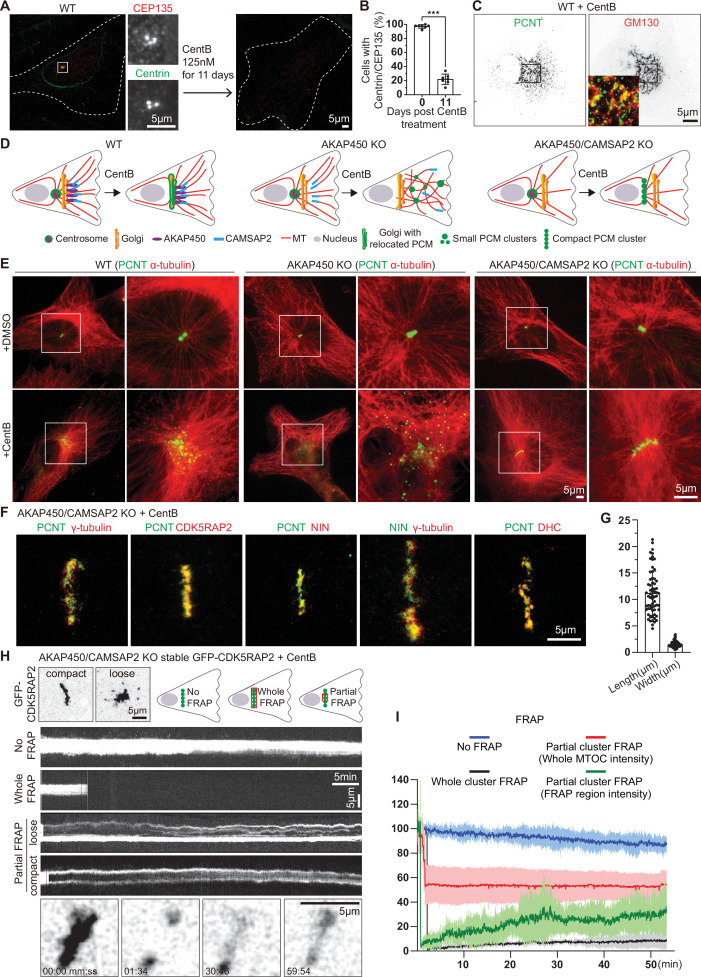
Figure 1—source data 1. An Excel sheet with numerical data on the quantifications shown in panels B, G, and I.
elife-77892-fig1-data1.xlsx (293.6KB, xlsx)

Figure 1.

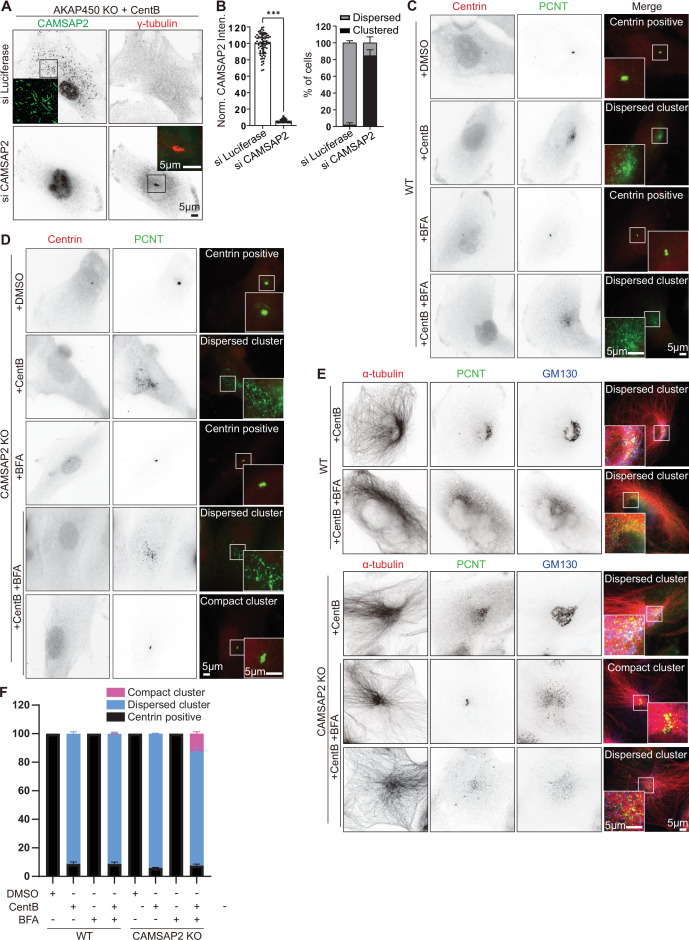
Figure 1—figure supplement 1. Characterization of caMTOCs in wild type, AKAP450 knockout and CAMSAP2 knockout cells.

Figure 1—figure supplement 1.

(A) Immunofluorescence images of centrinone B treated AKAP450 knockout RPE1 cells stained for CAMSAP2 (green) and γ-tubulin (red), transfected either with control (Luciferase) or CAMSAP2 siRNAs. Insets show enlargements of the merged images of the boxed areas. (B) Quantification of CAMSAP2 depletion and caMTOC formation related to panel A. For normalized CAMSAP2 intensity, n=76 (siLuciferase) and 62 (siCAMSAP2) cells from three independent experiment were analyzed; to calculate the percentage of cells showing dispersed or clustered PCM, n=300 (siLuciferase) and 299 (siCAMSAP2) cells analyzed for each measurement in three independent experiments. The statistical significance was determined by unpaired two-tailed Mann-Whitney test in Prism 9.1 (***p<0.001). Values represent mean ± SD. (C–E) Immunofluorescence images of wild type and CAMSAP2 knockout cells treated with DMSO, CentB, Brefeldin A (BFA) (5 µg/ml (17.8 µM) for 2 hrs), and stained for centrioles (Centrin, red), PCM (PCNT, green), microtubules (α-tubulin, red), and Golgi apparatus (GM130, blue). Insets show enlargements of the merged channels of the boxed areas. (F) Quantification of the proportion of cells with different types of microtubule minus end organization in wild type (WT) and CAMSAP2 knockout RPE1 cell lines with indicated treatment. 319 (+DMSO), 413(+CentB), 412(+BFA), 353(+CentB + BFA) WT cells and 340(+DMSO), 445(+CentB), 384(+BFA), 553(+CentB + BFA) CAMSAP2 knockout RPE1 cells analyzed for each measurement in three independent experiments (n=3). Values represent mean ± SD.
Figure 1—figure supplement 1—source data 1. An Excel sheet with numerical data on the quantifications shown in panels B and F.
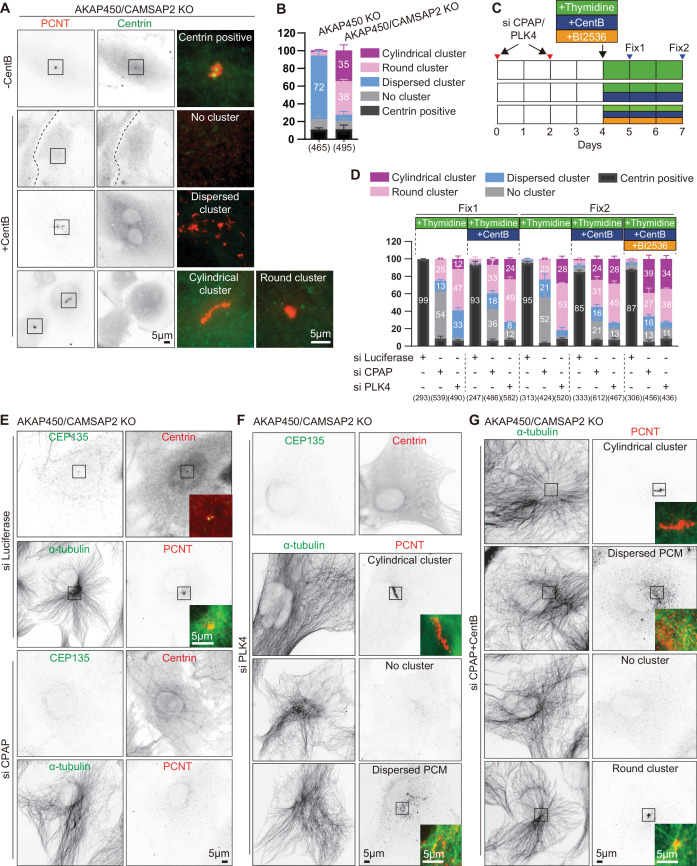
Figure 1—figure supplement 2. Characterization of caMTOCs in AKAP450/CAMSAP2 knockout cells.

Figure 1—figure supplement 2.

(A) Immunofluorescence images of control (-CentB) and centrinone-treated AKAP450/CAMSAP2 knockout RPE1 cells stained for pericentrin and centrin to show the main PCM organization types (centrin-negative cells with cylindrical or round PCM cluster, dispersed PCM or no cluster, and centrin-positive centrosomes) in each condition. Enlargements of the merged channels of the boxed areas are shown on the right. (B) Quantification of the main PCM organization types in centrinone-treated AKAP450 knockout and AKAP450/CAMSAP2 knockout RPE1 cells. Numbers on the histogram show the percentages. 465 (AKAP450 KO) and 495 (AKAP450/CAMSAP2 KO) cells analyzed for each measurement in three independent experiments (n=3). Values represent mean ± SD. (C) Diagram showing the generation of CPAP or PLK4 depleted AKAP450/CAMSAP2 knockout RPE1 cells with different drug treatments. Cells were transfected with siRNAs to depleted CPAP and PLK4 respectively. After 2 days, the transfection was performed again to increase the depletion efficiency. After 2 more days, cells were treated with thymidine to block cell proliferation or with a combination of thymidine and centrinone B, or thymidine, centrinone B and the PLK1 inhibitor BI 2536 for one or three days. Cells were fixed for the first time (Fix1) after a 24 hr drug treatment, and for the second time (Fix2) after a 72 hr drug treatment. (D) Quantification of the main PCM organization types, as described in panel A, for cells prepared as described in panel E-G. Numbers on the histogram show the percentages and numbers in brackets show cells analyzed for each measurement in three independent experiments (n=3; 247–612 cells analyzed per condition). Values represent mean ± SD. (E–G) Immunofluorescence images of Fix2 (as described in panel C) showing control (transfected with siRNA against Luciferase), or depleted of PLK4 or CPAP and treated as indicated. Cells were stained for centrioles (CEP135, centrin), PCM proteins (PCNT) and microtubules (α-tubulin). Images illustrate the PCM organization types in each condition. Insets show the merged channels of the boxed areas.
Figure 1—figure supplement 2—source data 1. An Excel sheet with numerical data on the quantifications shown in panels B and D.
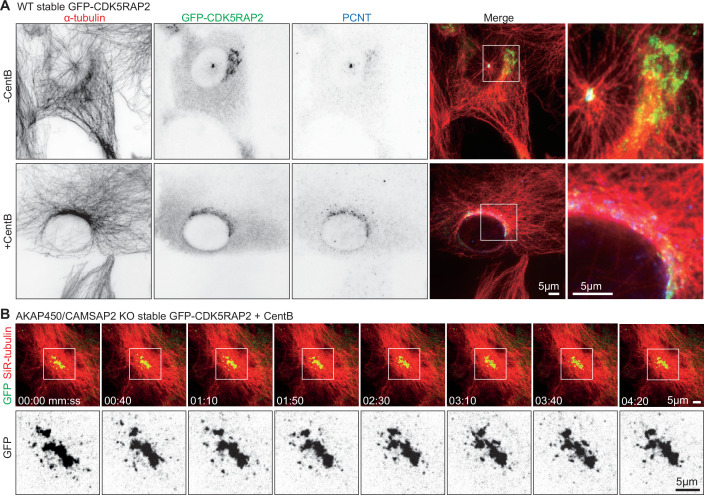
Figure 1—figure supplement 3. PCM dynamics visualized with GFP-CDK5RAP2.

Figure 1—figure supplement 3.

(A) Immunofluorescence images of control (-CentB) and centrinone B treated WT RPE1 cell stably expressing GFP-CDK5RAP2 (green) stained for α-tubulin (red) and pericentrin (PCNT, blue). Zooms show enlargements of the boxed regions. (B) Time-lapse images of centrinone-treated AKAP450/CAMSAP2 knockout RPE1 cells stably expressing GFP-CDK5RAP2. Microtubules are visualized by treating the cells with 100 nM SiR-tubulin overnight. PCM labeled with GFP-CDK5RAP2 (green) forms a stable cluster that functions as the MTOC. Zooms show the enlarged GFP channel of the boxed regions. Time is min: s.