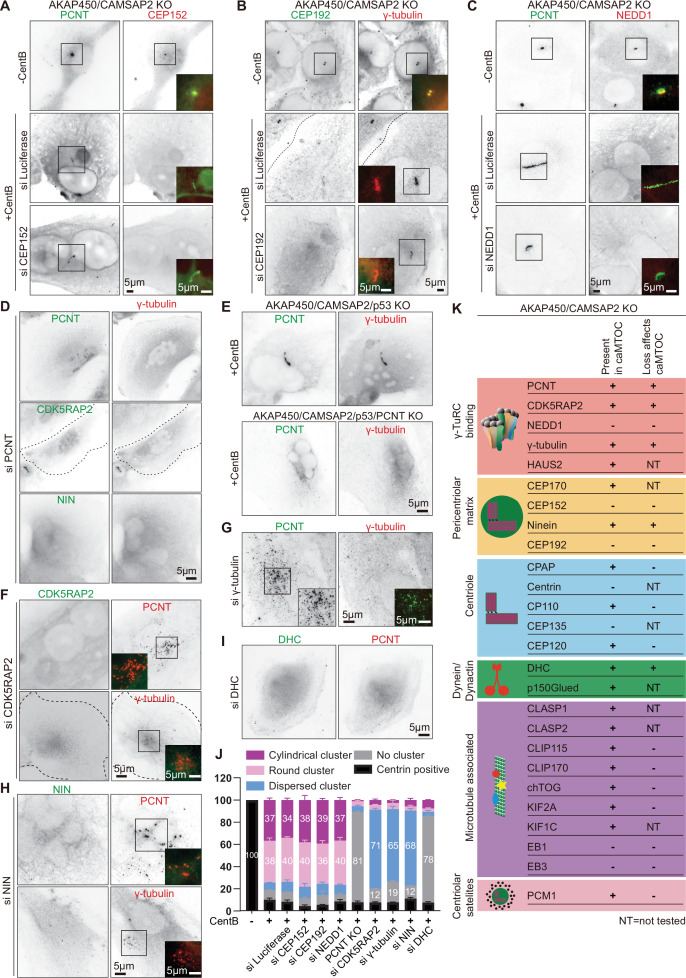
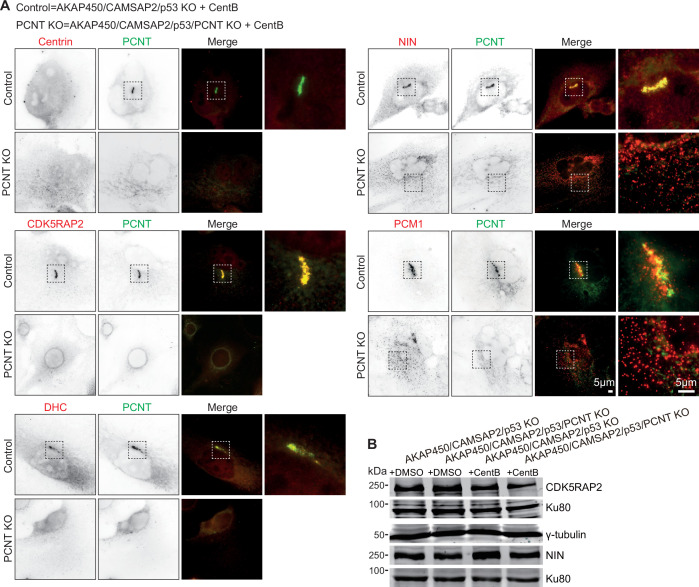
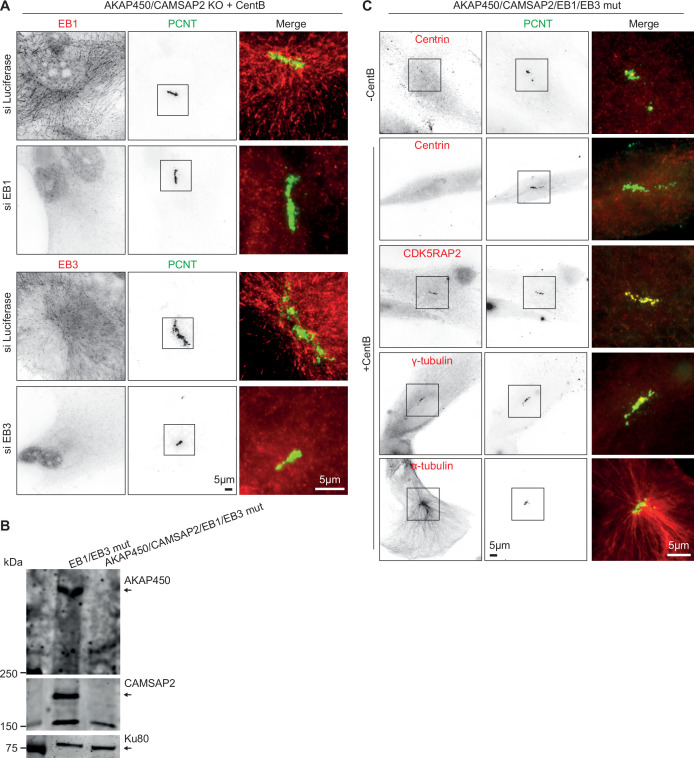
Figure 2. Molecular composition of caMTOCs in AKAP450/CAMSAP2 knockout cells.
All the cells used in this figure are AKAP450/CAMSAP2 knockout cells, except for panel E as indicated. (A–C) Immunofluorescence images of control or centrinone-treated AKAP450/CAMSAP2 knockout RPE1 cells stained for and depleted of the indicated proteins. (D, F–I) Immunofluorescence images of centrinone-treated AKAP450/CAMSAP2 knockout RPE1 cells stained for and depleted of the indicated proteins. (E) Immunofluorescence images of centrinone-treated AKAP450/CAMSAP2/p53 knockout and AKAP450/CAMSAP2/p53/pericentrin knockout RPE1 cells stained as indicated. In panels A-I, insets show enlargements of the merged channels of the boxed areas, and dashed lines indicate cell edges. (J) Quantification of the main PCM organization types, as described in Figure 1—figure supplement 2A, for cells prepared as described in panel A-C, E-I. Numbers on the histogram show the percentages. 1293 (-CentB), 1547(+CentB), 2021(siLuci), 1822(siCEP152), 1345(siCEP192), 1161(siNEDD1), 2302 (AKAP450/CAMSAP2/p53/PCNT knockout (PCNT KO)), 2264(siCDK5RAP2), 2510(siγ-tubulin), 2408(siNIN) and 2526(siDHC) cells were analyzed for each measurement in three independent experiments (n=3). Values represent mean ± SD. (K) Summarizing table of PCM localization and the depletion effects on caMTOC formation in AKAP450/CAMSAP2 knockout RPE1 cells. NT, not tested.

