. 2022 Jul 5;11:e77892. doi: 10.7554/eLife.77892

Figure 7. The role of the PCM in CAMSAP2-driven formation of caMTOCs.

(A,B) Immunofluorescence images of centrinone-treated AKAP450/CAMSAP2/p53/pericentrin knockout RPE1 cells transfected with 2FKBP-mCherry-CAMSAP2 and FRB-TagBFP-GCN4-ppKin14 and stained for the indicated components before (top) or after an overnight heterodimerizer treatment. Zooms show magnifications of boxed areas. Black dashed lines show the position of the nucleus. (C) Cells treated as described for panel A were co-transfected with GFP-pericentrin and stained for mitochondria (cytochrome C, red) and CAMSAP2 (red) in same channel overnight after heterodimerizer addition. Zooms show magnifications of boxed areas. (D) Quantification of the proportion of cells with different types of microtubule minus end organization before and after overnight heterodimerizer treatment. Numbers on the histogram show the percentages. 334 (-Heterodimerizer), 424(+Heterodimerizer) cells of AKAP450/CAMSAP2/p53/pericentrin knockout RPE1 cells, 206(-Heterodimerizer), and 239(+Heterodimerizer) of AKAP450/CAMSAP2/CDK5RAP2/MMG/p53/pericentrin knockout RPE1 cells analyzed for each measurement in three independent experiments (n=3). Values represent mean ± SD. (E) Immunofluorescence images of centrinone-treated AKAP450/CAMSAP2/CDK5RAP2/MMG/p53/pericentrin knockout RPE1 cells transfected with 2FKBP-mCherry-CAMSAP2 and FRB-TagBFP-GCN4-ppKin14 and stained for microtubules (α-tubulin, green) after an overnight heterodimerizer treatment. Zooms show magnifications of boxed areas.

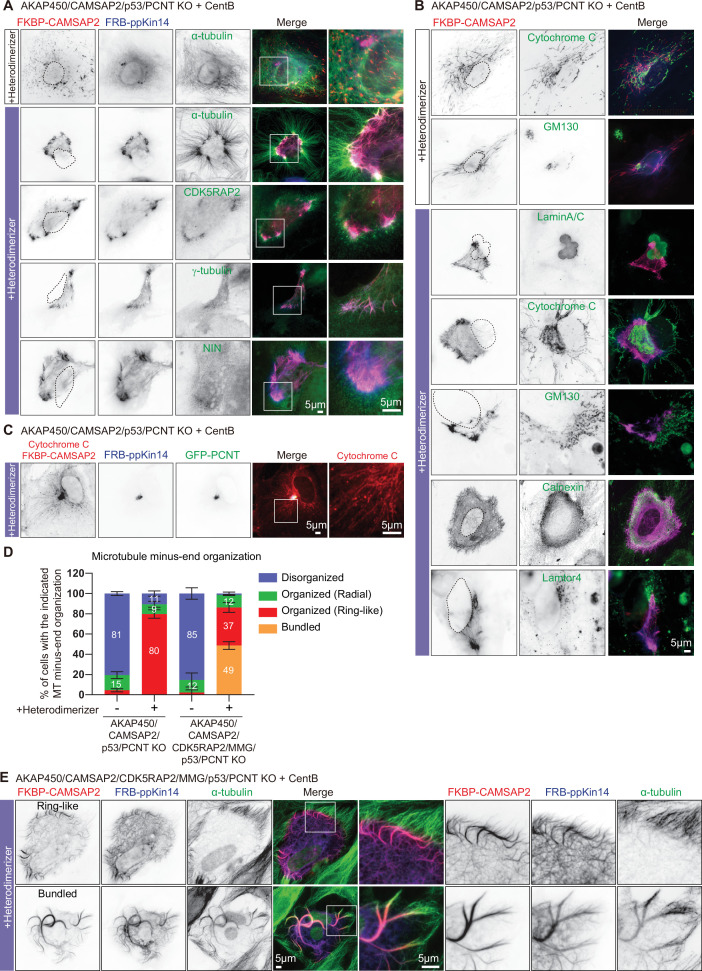
Figure 7—source data 1. An Excel sheet with numerical data on the quantifications shown in panel D.

Figure 7.

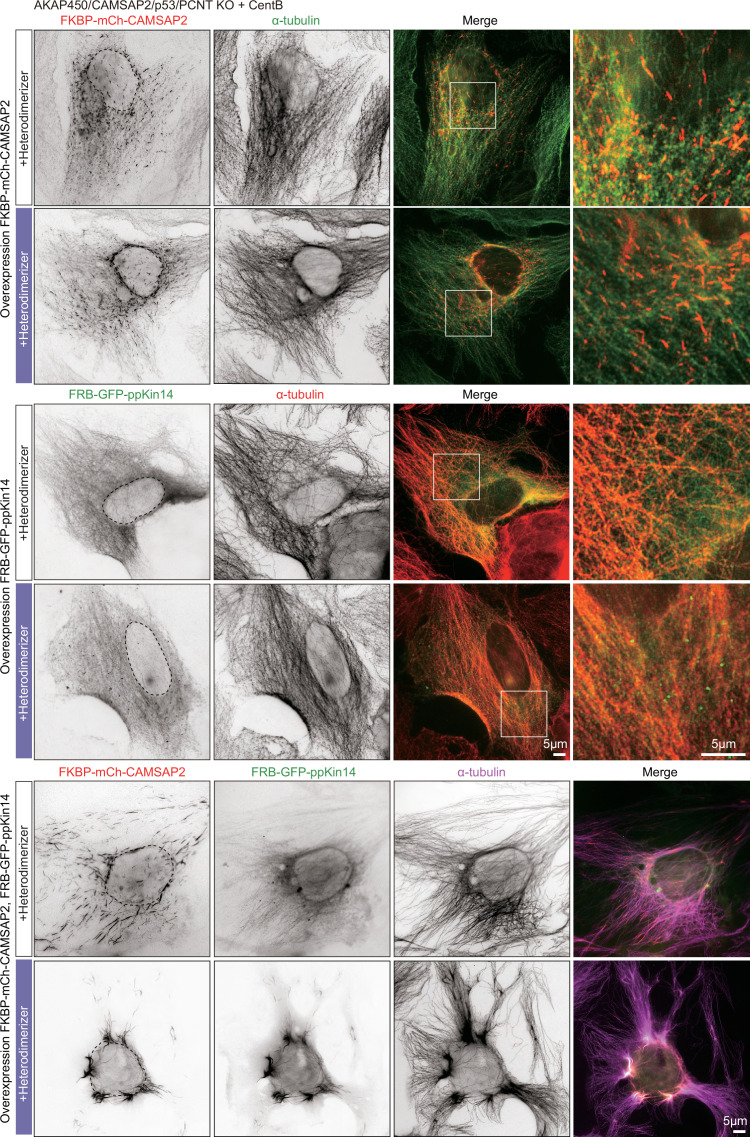
Figure 7—figure supplement 1. Inducible CAMSAP2-driven microtubule rearrangement in AKAP450/CAMSAP2/p53/pericentrin knockout cell.

Figure 7—figure supplement 1.

Immunofluorescence images of centrinone-treated AKAP450/CAMSAP2/p53/pericentrin knockout cells expressing either FKBP-mCh-CAMSAP2 alone, FRB-GFP-ppKin14 alone or both, with or without heterodimerizer treatment, and stained for microtubules (α-tubulin). Enlargements show the merged channels of the boxed areas.
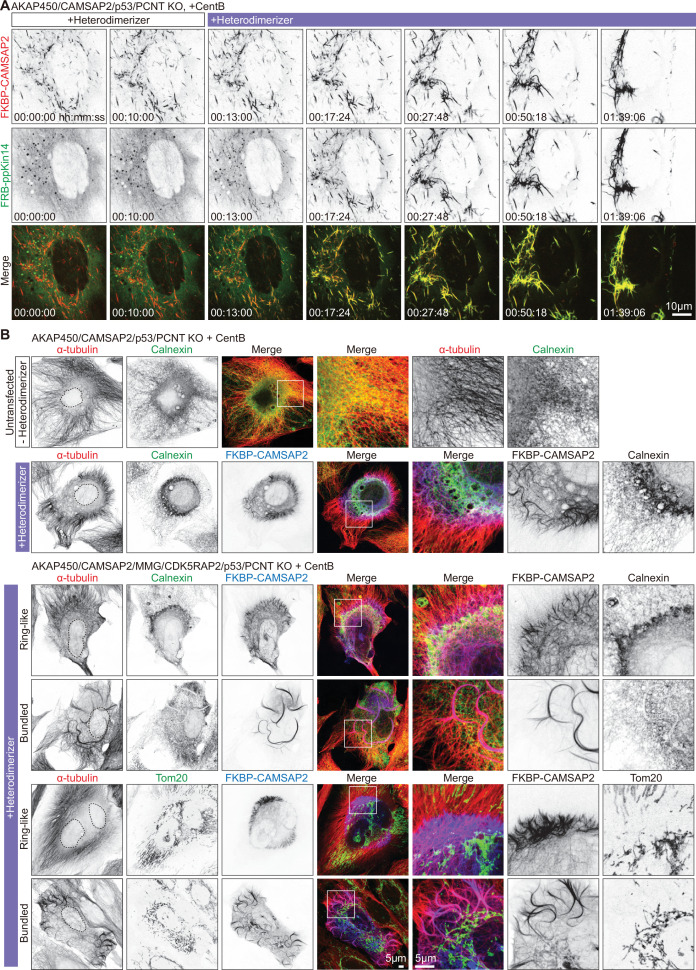
Figure 7—figure supplement 2. Inducible CAMSAP2-driven radial microtubule rearrangement in AKAP450/CAMSAP2/p53/pericentrin knockout cell.

Figure 7—figure supplement 2.

(A) Time-lapse images of a centrinone-treated AKAP450/CAMSAP2/p53/pericentrin knockout cell transiently expressing 2FKBP-mCherry-CAMSAP2 and FRB-GFP-GCN4-ppKin14 imaged for 10 min (100 frames, 6 s interval) prior to treatment with 100 nM heterodimerizer and ~90 min after. Time is hr: min: s. (B) Immunofluorescence images of centrinone-treated AKAP450/CAMSAP2/p53/pericentrin knockout and AKAP450/CAMSAP2/MMG/CDK5RAP2/p53/pericentrin knockout RPE1 cells, stained for the indicated markers. In the upper row, the cells were neither transfected nor treated with heterodimerizer, whereas in the other panels, cells were transfected with 2FKBP-mCherry-CAMSAP2 and FRB-HA-GCN4-ppKin14 and treated with heterodimerizer overnight. Zooms show the magnification of boxed areas.
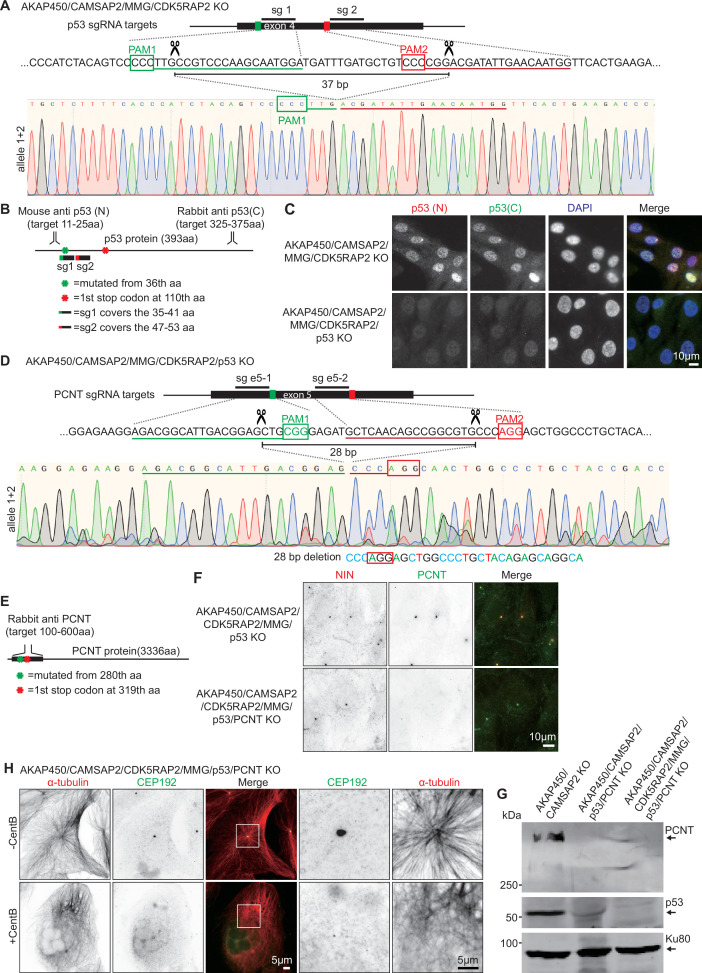
Figure 7—figure supplement 3. Generation of the AKAP450/CAMSAP2/CDK5RAP2/MMG/ p53/pericentrin knockout RPE1 cell line.

Figure 7—figure supplement 3.

(A) Diagram illustrating two sgRNA sites targeting p53 exon 4. The green and red boxes indicate the position of the PAM sites, and the predicted Cas9 cut sites are indicated by scissors. Genotyping results of the genomic mutation using gel-purified PCR product which covers exon 4 of the p53-encoding gene in AKAP450/CAMSAP2/MMG/CDK5RAP2/p53 knockout cell line are shown below. (B) Diagram illustrating the binding sites of p53 antibodies and the position of the mutation induced in p53-encoding gene. (C) Immunofluorescence images showing p53 staining in control and AKAP450/CAMSAP2/MMG/CDK5RAP2/p53 knockout cells. (D) Diagram illustrating two sgRNA sites targeting pericentrin exon 5. The green and red boxes indicate the position of the PAM sites, and the predicted Cas9 cut sites are indicated by scissors. Genotyping results of the genomic mutation using gel-purified PCR product which covers exon 5 of the pericentrin-encoding gene in AKAP450/CAMSAP2/MMG/CDK5RAP2/p53/pericentrin knockout cell line are shown below. (E) Diagram illustrating the binding domain of the pericentrin antibody and the positions of the mutations induced downstream of the Cas9 cut sites. (F) Immunofluorescence images showing the confirmation of pericentrin loss in control and AKAP450/CAMSAP2/MMG/CDK5RAP2/p53/pericentrin knockout cells. (G) Western blot illustrating the p53 and pericentrin loss in control and AKAP450/CAMSAP2/MMG/CDK5RAP2/p53/pericentrin knockout cells. (H) Immunofluorescence images of control and centrinone-treated AKAP450/CAMSAP2/CDK5RAP2/MMG/p53/pericentrin knockout cells staining microtubules (α-tubulin, red) and centrosomes (CEP192, green). Zooms show magnification of the boxed area.
Figure 7—figure supplement 3—source data 1. Full raw unedited western blots shown in panels F and G.