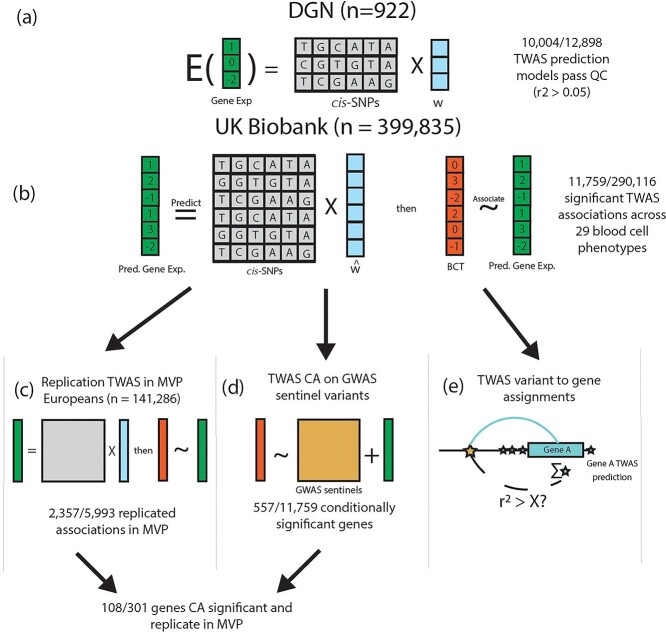
Figure 1.
UKB TWAS of blood cell traits overview. (A) We trained gene expression prediction models using whole blood gene expression data from 922 Depression Genes and Networks (DGN) European ancestry participants by fitting an elastic net model on the cis-SNPs (±1 Mb) for each gene. Models with r2 > 0.05 are considered sufficiently predicted, and are subject to association testing in UKB. w represents the TWAS weights in the prediction model. (B) Using our DGN-trained models, we predicted gene expression in 399 835 UKB participants of European ancestry and performed association testing with 29 hematological traits. 11 759 gene-trait associations were significant at the Bonferroni adjusted threshold (out of 290116 tested). (C) TWAS results from UKB were replicated in 141 286 MVP participants of European ancestry for 15 hematological traits available in MVP. (D) We further conditioned our TWAS significant associations in UKB on GWAS signals reported from Vuckovic et al. to determine which TWAS gene-trait associations were driven by previously reported GWAS variants (TWAS CA for TWAS CA). (E) We used the TWAS associations and prediction models (blue stars) to assign GWAS signals from Vuckovic et al. (gold star) to plausible target genes (see Fig. 2), assessing correlation between each GWAS variant and predicted gene expression of each TWAS significant gene.

