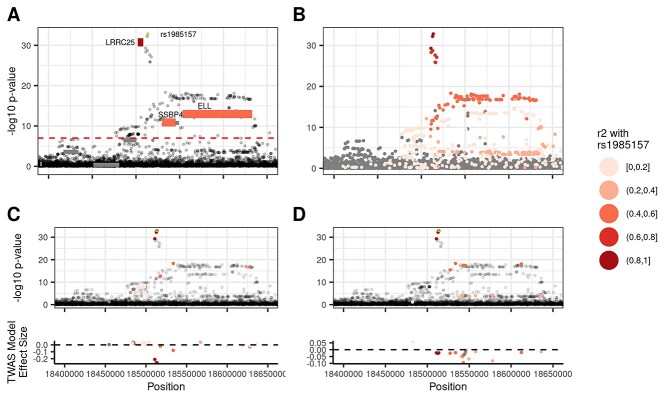
Figure 7.
TWAS assigns rs1985157 to LRRC25. Figure illustrates how TWAS assigned rs1985157 to LRRC25 when coloc failed to do so with no individual significant eQTL in the region. (A) LRRC25 predicted gene expression was highly correlated with rs1985157 (r2 = 0.863), whereas the prediction from SSBP4 (r2 = 0.47) and ELL (r2 = 0.457) were not as highly correlated despite both genes being significant. (B) LD patterns for variants at the locus. (C, D) Only model variants for LRRC25 and SSBP4 are colored by their LD with rs1985157, respectively. Variants with the largest TWAS weights (in absolute values) for LRRC25 are in high LD with rs1985157, whereas those for SSBP4 are not.

