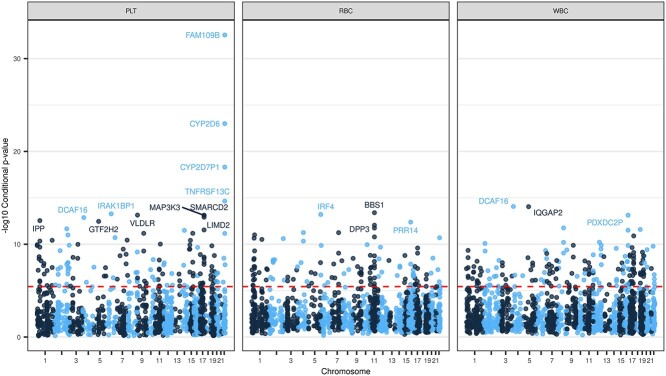
Figure 3.
Manhattan Plot of TWAS conditional analysis results. Figure shows the −log10(P-value) for TWAS gene-trait associations after conditioning on distinct GWAS variants from Vuckovic et al. for a given phenotype category. The red dashed line denotes the Bonferroni adjusted significance threshold ( = 4.25 × 10⁻⁶). Named genes have −log10(P-value) > 12. The conditional TWAS analysis assesses whether a TWAS signal is driven primarily from signals at previously discovered GWAS loci, which is a crucial step for our analysis of well-studied hematological traits. The maximum −log10(P-value) for each gene is plotted and stratified by phenotype category.

