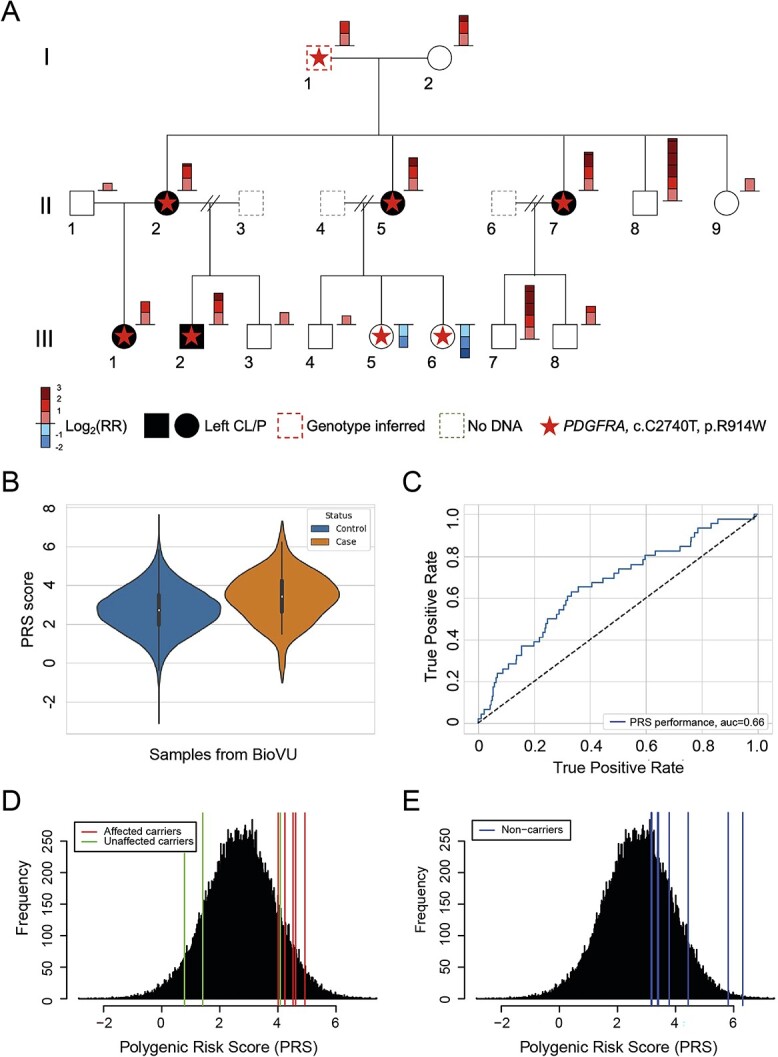
Figure 1.

The penetrance of PDGFRA variant is modified by PRS from known NSCL/P risk loci in a multigenerational family. (A) WGS and PRS results for a three-generation NSCL/P family. Individuals with NSCL/P are depicted by solid black rectangles and circles. The red dashed rectangle indicates the individual with imputed genotypes. Gray dashed rectangles indicate individuals without available DNA or genotype information. The colored bar to the right of each individual shows the PRS-derived relative risk (RR) of NSCL/P on a log2 scale. RR is calculated as the ratio of estimated PRS of each individual versus the average PRS of 72 496 non-Hispanic European individuals from BioVU. The red star indicates carrier status for PDGFRA c.C2740T. Individuals I-2, II-1, II-5, II-7, III-1 and III-2 were submitted for WGS. (B) Violin plots of the distributions of PRS in 46 cases and 72 496 controls from BioVU. (C) Receiver operating characteristic (ROC) curve for PRS for the diagnosis of NSCL/P in BioVU samples. ROC was performed for PRS using NSCL/P patients and controls from BioVU. (D–E) The comparison of PRS of the NSCL/P family and the background distribution of controls from BioVU. Each vertical line represents one individual in the family: red lines indicate affected individuals with PDGFRA c.C2740T variant, green lines indicate unaffected individuals with PDGFRA c.C2740T variant, and blue lines indicate unaffected individuals without PDGFRA c.C2740T variant.
