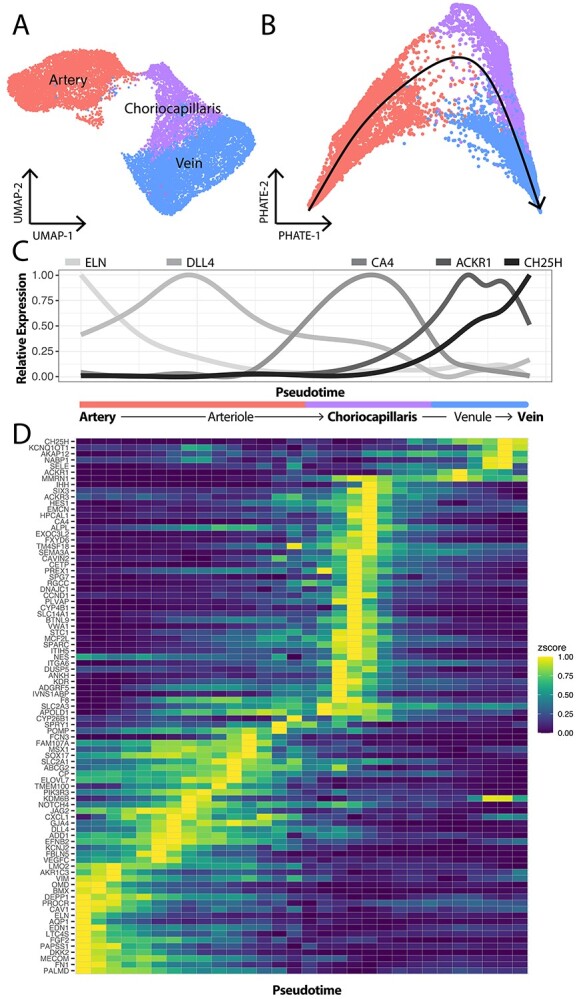
Figure 4.

Trajectory analysis recapitulates the anatomic structure of the choroidal vascular tree. (A) Three distinct endothelial clusters (arteries, choriocapillaris and veins) were identified by scRNA-seq. (B) The PHATE dimensionality reduction method was applied to the endothelial expression data to better visualize progression from one cell state to another. Trajectory analysis was performed using slingshot (black line) to model expression changes from arteries to capillaries to veins. (C) Expression changes of five genes were visualized across this trajectory. The pseudotime trajectory is visualized along the x-axis; values on the left correspond to cells mapped to the arterial end of the trajectory while values on the right correspond to cells from the venous end. Previously reported arteriole (DLL4)- and venule (ACKR1)-specific genes demonstrated maximal expression at the artery–choriocapillaris and choriocapillaris–vein interface. (D) Differential expression was performed to identify genes enriched in arteries, arterioles, choriocapillaris, venules and veins. The expression of each gene was scaled from zero (dark blue) to one (yellow) and expression was visualized across pseudotime (x-axis) in a heatmap.
