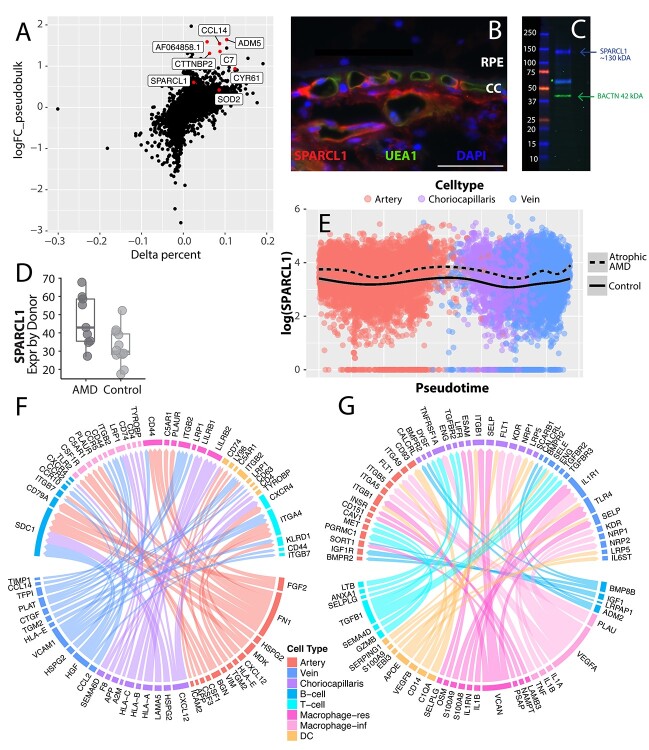
Figure 5.
Genes enriched in early atrophic AMD endothelial cells. (A) Differential expression between early atrophic AMD (n = 9) and control (n = 10) choriocapillaris endothelial cells. The y-axis depicts a (pseudobulk) log-fold change, with positive values reflecting increased expression in early atrophic AMD donors (see Materials and Methods). The x-axis depicts a variable termed delta percentage, which is calculated by: (percentage of AMD cells that express the gene) − (percentage of control cells that express the gene). Genes with a positive delta percentage are expressed by a higher proportion of AMD cells. (B) SPARCL1 (red) labels the choroidal endothelial cells, including the choriocapillaris, of a human donor choroid. The endothelial-specific lectin UEA-1 (green) co-labels choroidal endothelial cells. (C) A western blot of protein isolated from the human choroid. A SPARCL1 band is visible at the molecular weight of 130 kDa (40) in addition to a smaller, possibly proteolytic fragment ~60 kDa (41). (D) Comparison of SPARCL1 choriocapillaris expression between early atrophic AMD and control donors. The average SPARCL1 expression is depicted on a donor-by-donor basis (each dot represents the average SPARCL1 expression of one donor). (E) SPARCL1 expression is compared across pseudotime (see Fig. 4) stratified by AMD status. There is an increase in SPARCL1 expression across the choroidal vascular tree in early atrophic AMD. (F, G) Ligand–receptor interactions are visualized between endothelial and immune subpopulations. Ligand–receptor pairs are only visualized if at least one member of the pair is enriched in early atrophic AMD cells above a (pseudobulk) log-fold change of 0.5. In (F), endothelial-expressed ligands are visualized with their immune cell targets. In (G), immune-expressed ligands are visualized with their endothelial targets.

