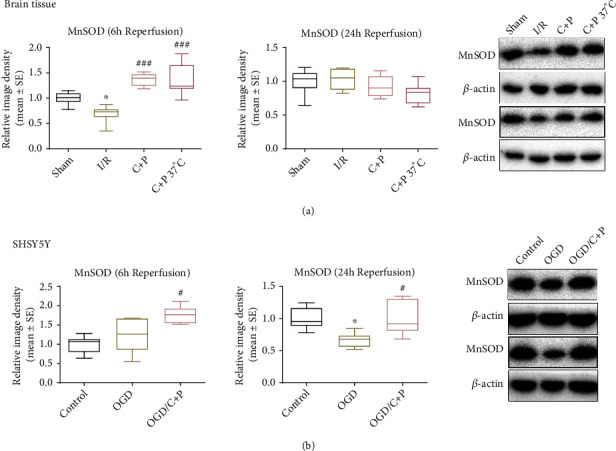
Figure 7.

C+P facilitated the expression of MnSOD after cerebral ischemia or OGD/R. (a) Representative bands of MnSOD in brain tissue as identified using Western blot at 6 and 24 hours of reperfusion. β-Actin served as an internal control. Semiquantitative levels of MnSOD are displayed in bar graphs, identified using band density analysis. MnSOD protein levels decreased after I/R. C+P administration significantly accelerated MnSOD expression at 6 hours of reperfusion (n = 7). ∗p < 0.05 versus the sham group; ###p < 0.001 versus the I/R group. The data is presented as mean ± SE. (b) Representative bands of MnSOD expression in SHSY5Y cells as identified using Western blot at 6 and 24 hours of reoxygenation. β-Actin protein served as an internal control. Bar graphs show semiquantitative levels of MnSOD as identified using band density analysis. MnSOD protein levels decreased at 24 hours of reoxygenation. However, C+P therapy elevated MnSOD expression at 6 and 24 hours of reoxygenation. ∗p < 0.05 versus the OGD group; #p < 0.05 versus the OGD/C+P group. Results are shown as mean ± SE of three independent experiments.
