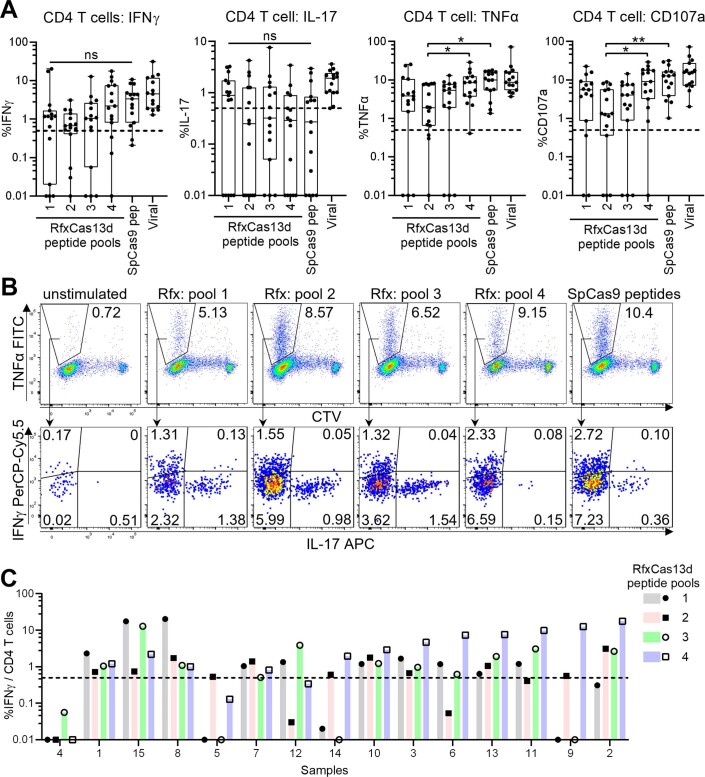
Extended Data Fig. 6. Cytokine profile of peptide-stimulated RfxCas13d specific CD4 T cells.
(a) Aggregate responses are shown, with each data point representing one sample. (n = 15 biologically independent samples). Each sample was tested across all conditions shown. To ensure cytokine responses are indeed from cells expanded by peptide stimulation, each data point plots values after subtracting background responses from controls expanded with no peptide (DMSO) but re-stimulated with the tested peptide pool. For box-plots, center line indicates median, box limits indicate 25th and 75th percentiles, whiskers show minimum to maximum value. Dashed line indicates the limit of detection for peptide specific responses. Differences in treatment conditions were tested using Friedman’s test with two-sided Dunn’s multiple comparisons test across the SpCas9 and 4 RfxCas13d peptide pools. (ns, not significant, * p < 0.05, ** p < 0.01). (b) Representative flow cytometric analysis of cytokine responses from one sample is shown, indicating the detection of IFNγ and IL-17 responding cells within the TNFα producing proliferated cell population. Percentages shown are frequency among total CD4 T cells. (c) CD4 T cell IFNγ responses from each sample is shown. Samples are sorted based on the peptide pool which elicited the strongest responses.

