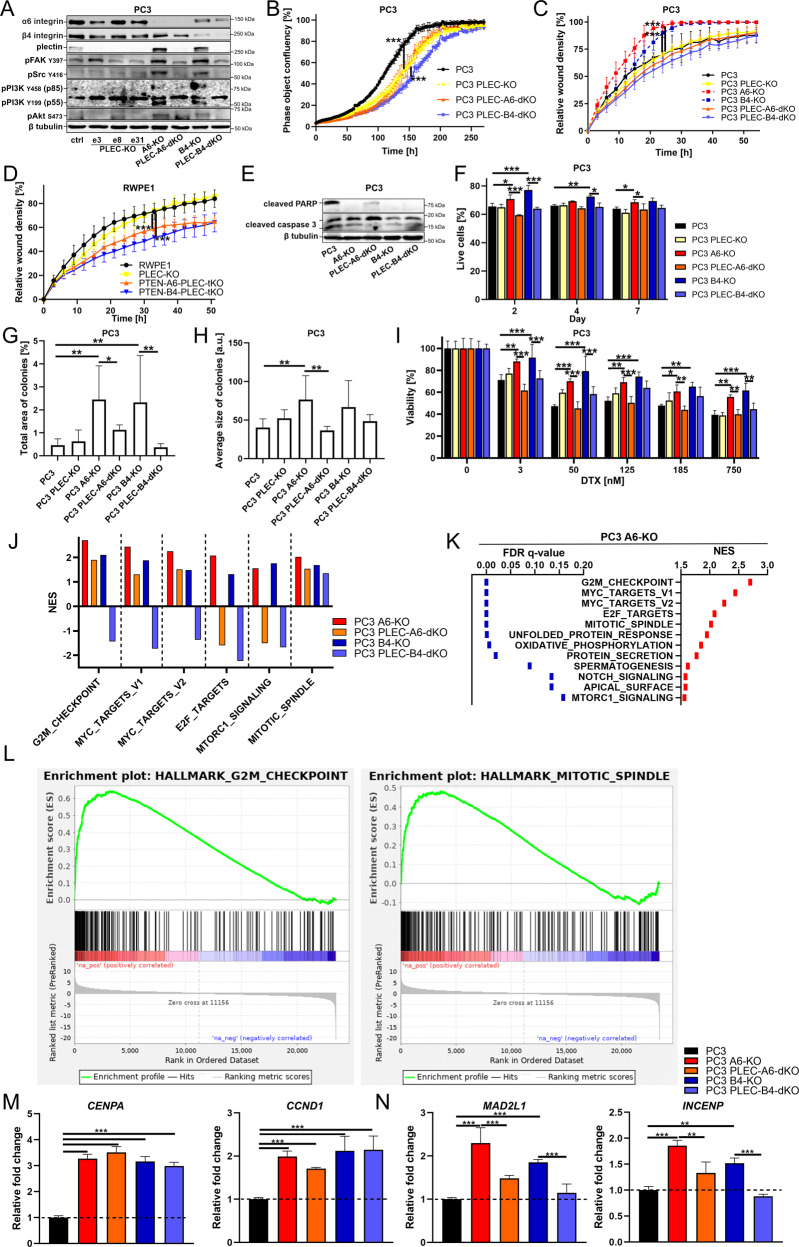
Fig. 4. Plectin is required for the tumorigenic properties induced by dual loss of HDs and PTEN.
A Western blot analysis of the indicated signaling proteins in PC3, PC3-PLEC-KO, PC3-α6-KO, PC3-PLEC-α6-dKO, PC3-β4-KO, and PC3-PLEC-β4-dKO cell lines. B Cell proliferation and C wound-closure analysis of PC3, PC3-PLEC-KO, PC3-PLEC-α6-dKO, and PC3-PLEC-β4-dKO cells using IncuCyte S3. The data shown is a representative experiment of three independent repeats showing the mean ± SD from a minimum of 4 replicates per sample. D Wound-closure analysis was performed for RWPE1, RWPE1-PLEC-KO, RWPE1-PTEN-α6-PLEC-tKO and RWPE1-PTEN-β4-PLEC-tKO cells as described in C. E Western blot analysis of apoptosis markers cleaved caspase-3 and cleaved PARP in PC3, PC3-α6-KO, PC3-PLEC-α6-dKO, PC3-β4-KO and PC3-PLEC-β4-dKO. F The indicated PC3 cell variants grown for 2, 4 or 7 days on polyHEMA-coated plates were harvested and subjected to analysis of anoikis resistance using the Annexin V/propidium iodide. The data shows the mean ± SD from three independent experiments. The different PC3 cell variants were grown for 21 days in soft agar followed by the determination of G the total area of colonies and H the average size of individual colonies. The data shows the mean ± SD from three independent experiments. I PC3, PC3-PLEC, PC3-α6-dKO, PC3-PLEC-α6-dKO, PC3-β4-KO, and PC3-PLEC-β4-dKO cells were grown for 72 h in the presence of the indicated concentrations of docetaxel followed by the analysis of cell viability using an MTT-assay. The data shows the mean ± SD from three independent experiments. J Comparison of the most enriched pathways in the indicated PC3 cell variants revealed by the RNA-Seq analysis. K The list of top-enriched pathways upregulated in PC3-α6-KO cells when compared with the parental PC3 cells. L Enrichment plots of the 1st- and 5th- ranked pathways in PC3-α6-KO cells. M Quantitative PCR analysis in the different PC3 cell variants to validate upregulation of selected plectin-independent and N plectin-dependent target genes of the G2M checkpoint pathway. The analysis was performed in triplicate and is presented as mean ± SD. All the western blot data in this figure are representative of at least three independent experiments. Asterisks indicate significance (p-value: *<0.05; **<0.01; ***<0.001).

