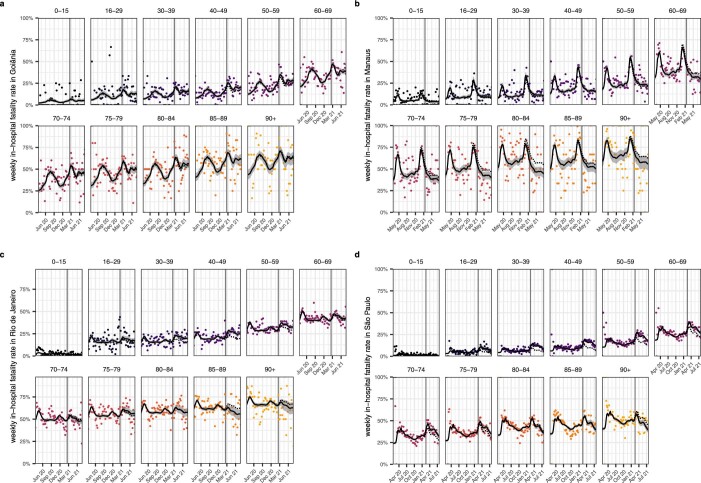
Extended Data Fig. 8. Model fits to age-specific COVID-19 in-hospital fatality rates.
Weekly, age-specific in-hospital fatality rates are shown as dots. Posterior median estimates of the expected in-hospital fatality rates across variants from the Bayesian multi-strain fatality model, Equation. (8), are shown on the y-axis (black line) along with 95% credible intervals (grey ribbon). The expected in-hospital fatality rates of non-Gamma variants, Equation (6a), are shown as dotted line. The date of Gamma’s first detection is indicated as a vertical line. Data are shown for Goiânia (a), Manaus (b), Rio de Janeiro (c), and São Paulo (d).

