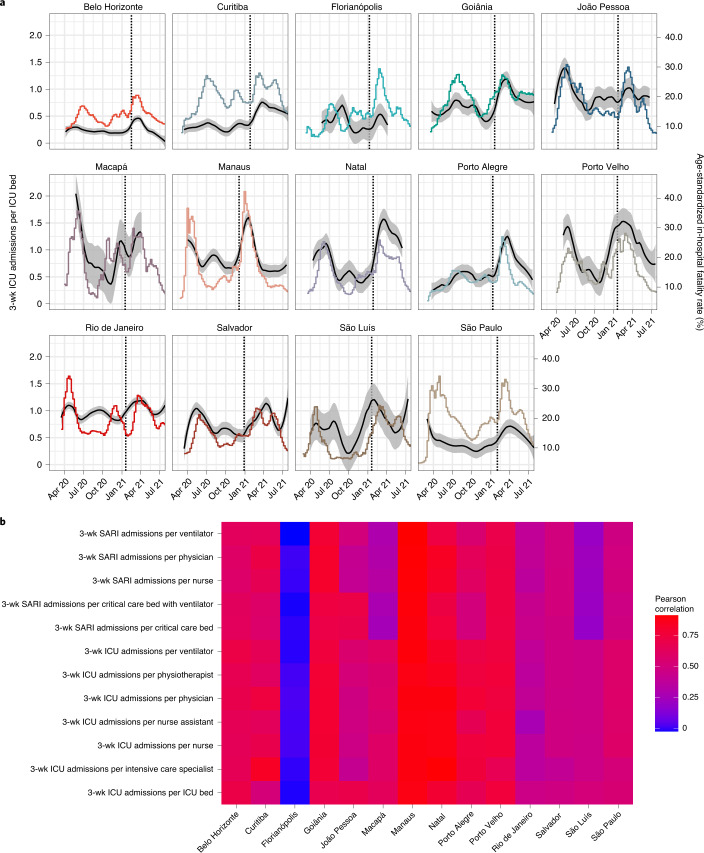
Fig. 3. Time trends in age-standardized COVID-19 in-hospital fatality rates and pandemic healthcare pressure.
a, Non-parametric median estimates (lines) and 95% confidence interval (ribbons) of age-standardized COVID-19 in-hospital fatality rates (black, right-hand-side axis) are shown against the healthcare pressure index of ICU admissions over 3 weeks per available ICU bed in each city (color, left-hand-side axis). The date of first detection of Gamma is added as a vertical dashed line. b, Heat map of Pearson correlation coefficients between age-standardized in-hospital fatality rates and each pandemic healthcare pressure index. SARI, severe acute respiratory infection; wk, week.

