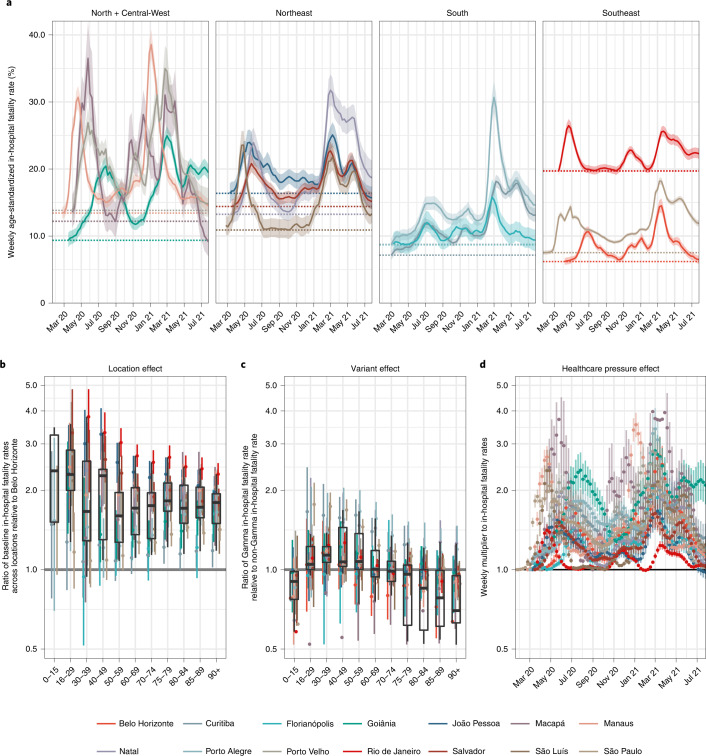
Fig. 4. Estimated contribution of location effects, infection severity of Gamma and pandemic healthcare pressure on COVID-19 in-hospital fatality rates.
a, Estimated weekly age-standardized COVID-19 in-hospital fatality rates, averaged across SARS-CoV-2 variants. Posterior median estimates (line) are shown with 95% CrIs (ribbon) and the lowest estimated fatality rates before detection of Gamma in each state capital (dotted horizontal line). b, Estimated ratio in lowest in-hospital fatality rates in each location relative to that seen in Belo Horizonte. c, Estimated ratio in in-hospital fatality rates for Gamma versus non-Gamma lineages of SARS-CoV-2. d, Estimated multiplier to the lowest age-standardized fatality rates before Gamma’s detection shown in a, which is associated with the pandemic healthcare pressure indices. In each plot, posterior median estimates are shown as dots and 95% CrIs as linerange. Box plots summarize posterior medians across locations (n = 14): the middle line is the median; the box limits represent the upper and lower quartiles; and the whiskers extend to the extreme values that are no further than 1.5 times the interquartile range. Multipliers and ratios in b–d are reported on a logarithmic scale. Posterior estimates with CrI width larger than 3 were removed for clarity of presentation.

