
FIGURE 4.
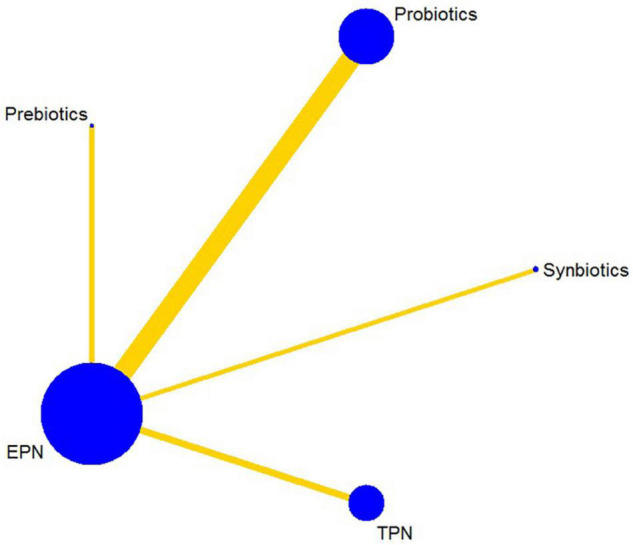
Network plot of all intervention comparisons for ventilator-associated pneumonia. The size of the nodes corresponds to the total number of participants that study the treatments. The (directly) comparable treatments are linked with a line. The thickness of the line corresponds to the standard error of trials that study this comparison. The colors of the line correspond to the quality of trials that study this comparison. Moderate risk of bias [yellow]. EPN, enteral nutrition and/or adjuvant peripheral parenteral nutrition. TPN, total parenteral nutrition.