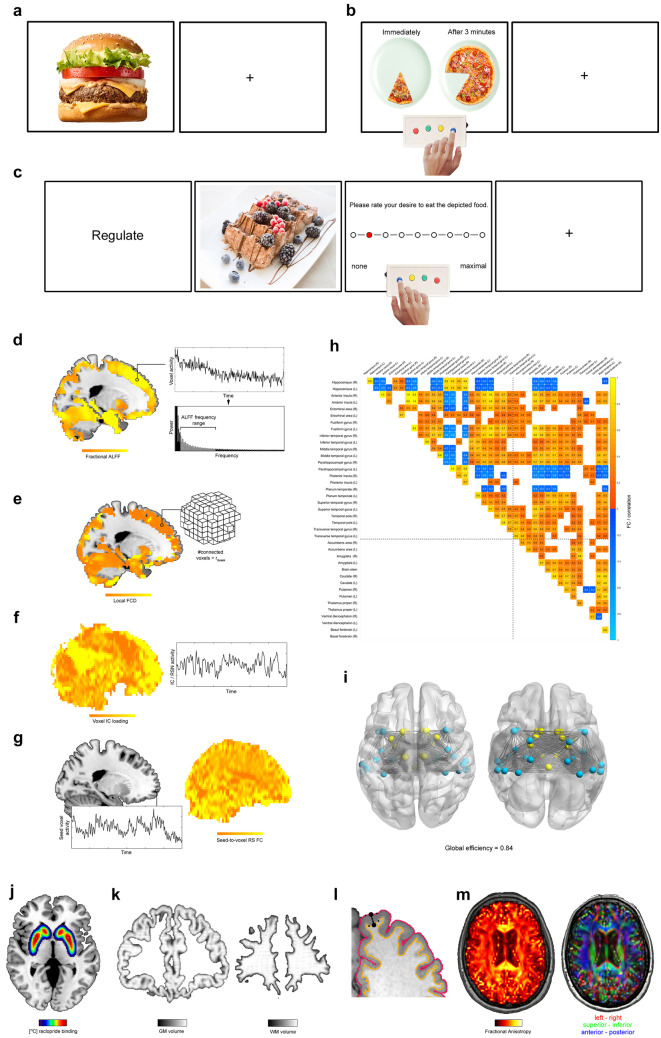
Fig. 1.
Neuroimaging techniques and parameters utilized in the reviewed studies. (a)–(c) illustrate the basic layouts of the three fMRI tasks, i.e., CR (a), DD (b), and food CrvR (c). The panels (d)–(i) depict the different parameters derived from RS fMRI. In particular, 1d illustrates the ALFF method, (e) FCD mapping. (f) shows a component loading map for a RS-network extracted by independent component analysis. Moreover, (g) illustrates the seed-to-voxel FC approach. (h) shows a correlation (i.e., FC) matrix obtained for temporal and deep GM regions for RS fMRI data of a single subject and time point. FC depicted is thresholded at r =|0.5|. (Only) temporal and deep GM regions were selected to facilitate a better readability of the panel. The network depicted in (i) corresponds to the areas / FC depicted in the correlation matrix in (h). This network has a global efficiency of 0.84. (j) illustrates a PET scan using the [11C] raclopride radio-tracer. Finally, (k)–(m) depict the structural MRI measures. Specifically, (k) shows a brain voxel map of the GM (left) and WM (right) volume of a participant determined with VBM. (l) illustrates an approach to cortical thickness estimation that treats the distance between two closest vertices on the opposing WM/GM surface and the GM/pial surface as measure of cortical thickness for the corresponding cortex segment. (m) illustrates the fractional anisotropy determined with DTI for a single participant and time point on the left. In order to illustrate the directional information contained in DTI maps (and used for fiber tractography), the direction of the first tensor for a given voxel is depicted with a red–green–blue coding on the right. For further details, see text

