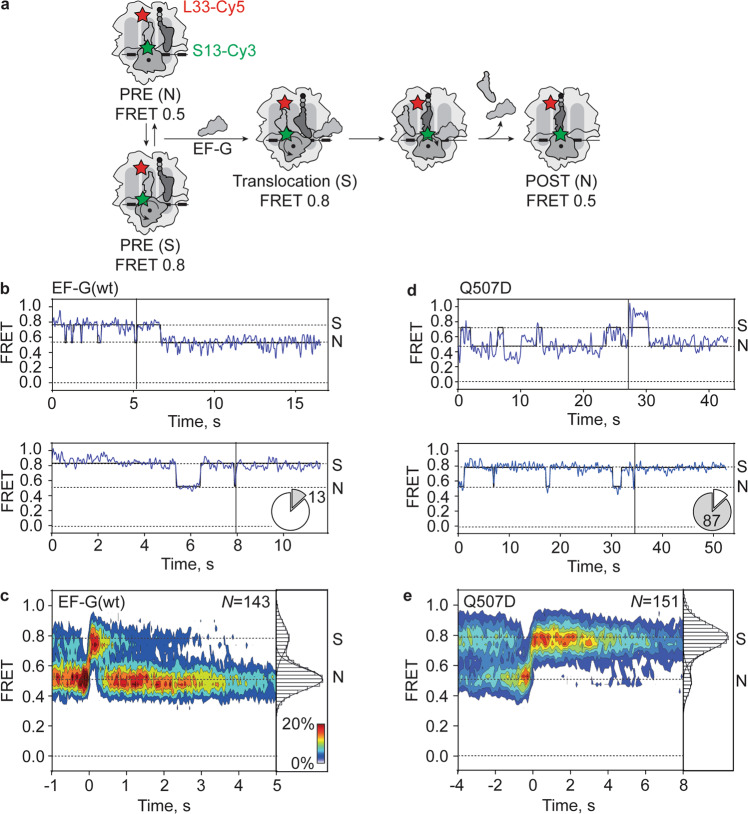
Fig. 6. SSU head domain swiveling during translocation on slippery mRNA.
a Schematic of smFRET experiment. Movement of SSU head domain during translocation induced by addition of EF-G to immobilized PRE complexes monitored with FRET labels on ribosomal proteins S13 (S13-Cy3, green star) and L33 (L33-Cy5, red star). FRET values representing the non-swiveled (N) and swiveled (S) states are determined in independent experiments (Supplementary Fig. 9 and Table 3). b Representative smFRET time traces for SSU head movements during EF-G(wt)-induced translocation. The majority of traces (upper panel) show fluctuations between FRET 0.8 (S) and 0.5 (N) followed by a stable FRET 0.5 (N) state after translocation. 13% of traces (lower panel) show no transition to the N state in the time course of the experiment. Pie charts indicate the percentage of traces ending in N (white) or S (gray) state. Black vertical lines represent the synchronization point, i.e., the last transition to FRET 0.8 (S) (see below). c Contour plot showing distribution of FRET values representing SSU head movement during translocation on slippery mRNA by EF-G(wt). Traces were synchronized to the last transition to FRET 0.8 (S). The duration of the last FRET 0.8 state is an estimate for the duration of translocation, because back swiveling occurs simultaneously with the dissociation of EF-G from the ribosome after translocation38. Histogram at the right shows distribution of FRET values after synchronization. Data are from four independent experiments (N = 4). d Representative smFRET time traces for SSU head domain movement during translocation on slippery mRNA with EF-G(Q507D). A small fraction of traces (upper panel) show fluctuations between FRET 0.8 (S) and 0.5 (N) and end in a stable FRET 0.5 (N) state after translocation. 87% of traces (lower panel) show no transition to the N state in the time course of the experiment. e Contour plot showing distribution of FRET values representing SSU head domain movement during translocation on slippery mRNA by EF-G(Q507D). Histogram at the right shows the distribution of FRET values after synchronization. Data are from three independent experiments (N = 3).

