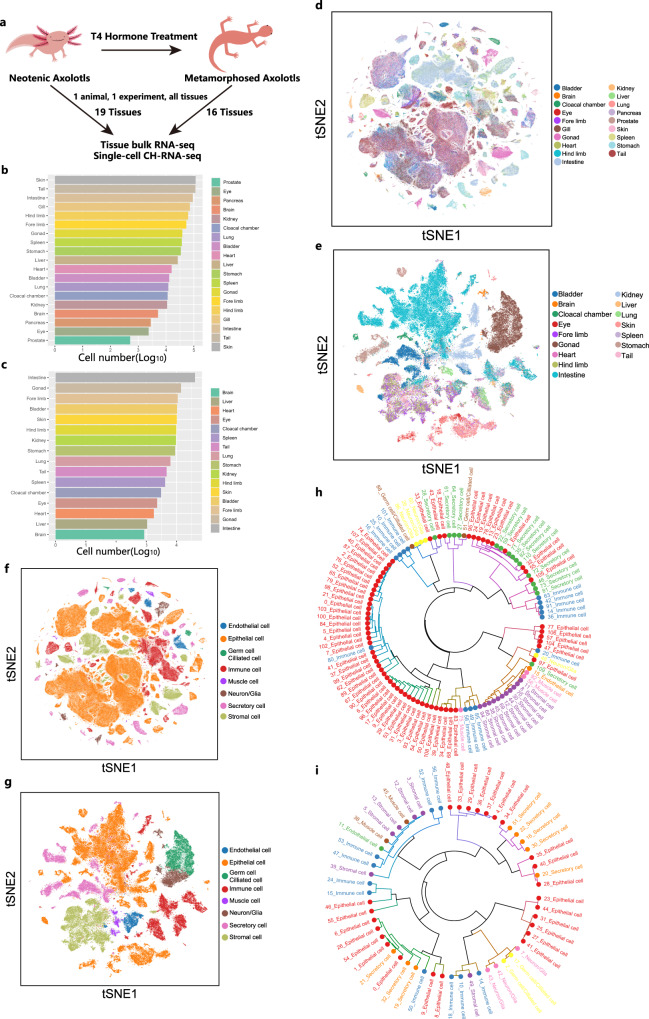
Fig. 2. Mapping the axolotl cell landscape.
a Experimental design of axolotl metamorphosis induction and adult axolotl cell landscape construction (number of biological replicates: neotenic axolotl CH-RNA-seq, n = 5; metamorphosed axolotl CH-RNA-seq, n = 3; bulk RNA-seq of neotenic axolotls, n = 2; bulk RNA-seq of metamorphosed axolotls, n = 2). Bar plots showing the number of cells detected in each tissue from adult neotenic axolotls (b) and metamorphosed axolotls (c) (log10 scale). t-stochastic neighbor embedding (tSNE) plots showing all the single cells profiled using CH-RNA-seq in adult neotenic axolotls (d) and adult metamorphosed axolotls (e), colored by tissues. tSNE plots showing all the single cells profiled using CH-RNA-seq in adult neotenic axolotls (f) and metamorphosed axolotls (g), colored by major cell types. Hierarchical trees showing the relationship between cell types in adult neotenic axolotls (h) and metamorphosed axolotls (i). Each hierarchy was built by performing hierarchical clustering on the area under the receiver operating characteristic (AUROC) scores acquired from MetaNeighbor analyses. Node color indicates the cell lineage for each cell type. The main branches, corresponding to the taxonomy, are annotated with cell lineages.

