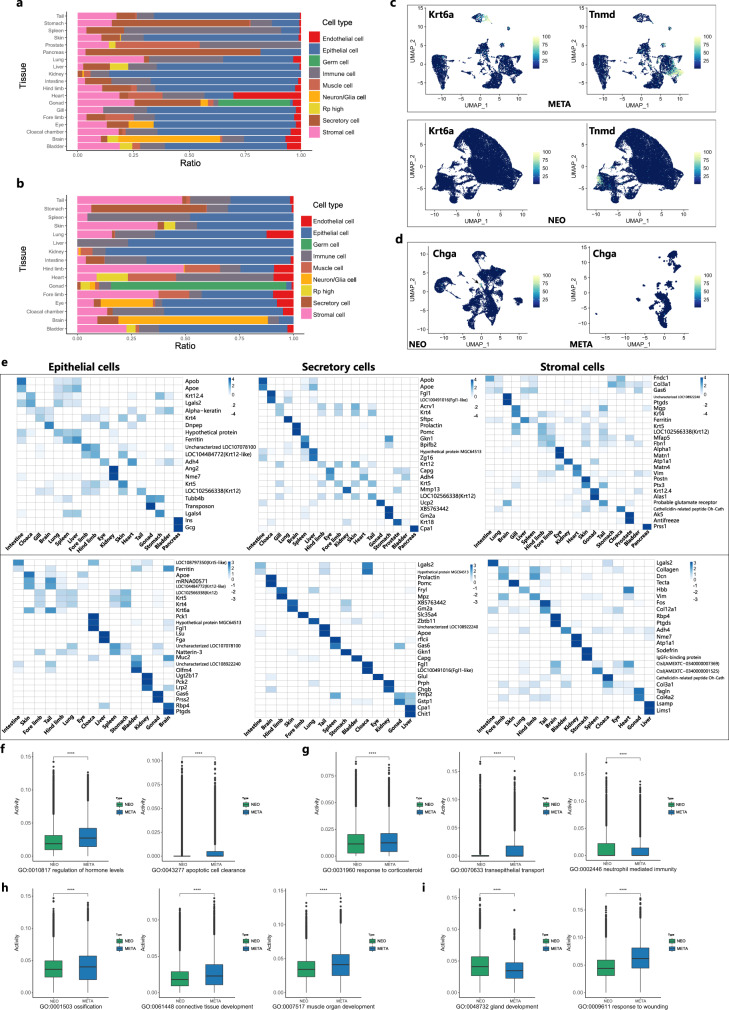
Fig. 5. Inner heterogeneity of major nonimmune parenchymal cell types in neotenic and metamorphosed axolotls.
Bar plots showing the fraction of cells per tissue derived from annotated major cell types in neotenic axolotls (a) and metamorphosed axolotls (b). c Feature plots visualization of Krt6a and Tnmd in neotenic axolotl (NEO) and metamorphosed axolotl (META) forelimbs. d Feature plots visualization of Chga in neotenic axolotl (NEO) and metamorphosed axolotl (META) hearts. e Heatmaps showing the top differentially expressed marker genes across tissues in three major cell types from adult neotenic axolotls (top: NEO) and metamorphosed axolotls (bottom: META). The color represents the expression level. Bar plots showing the activity of selected gene ontology (GO) enrichment terms in epithelial cells (f) (META: n = 54,036 cells, NEO: n = 458,162 cells), secretory cells (g) (META: n = 24,711 cells, NEO: n = 73,786 cells), stromal cells (h) (META: n = 27,466 cells, NEO: n = 77,572 cells), endothelial cells (i) (META: n = 3267 cells, NEO: n = 23,924 cells) from neotenic axolotls (NEO, green) and metamorphosed axolotls (META, blue) (n = number of cells, the boxplots are defined by the 25th and 75th percentiles, with the centre as the median, the minima and maxima extend to the largest value until 1.5 of the interquartile range and the smallest value at most 1.5 of interquartile range, respectively. “****”: p values < 0.001, in all cases, p value < 2.22e-10, t test was introduced, adjustments p values were made after p value is corrected by Benjamin & Hochberg multiple test).

