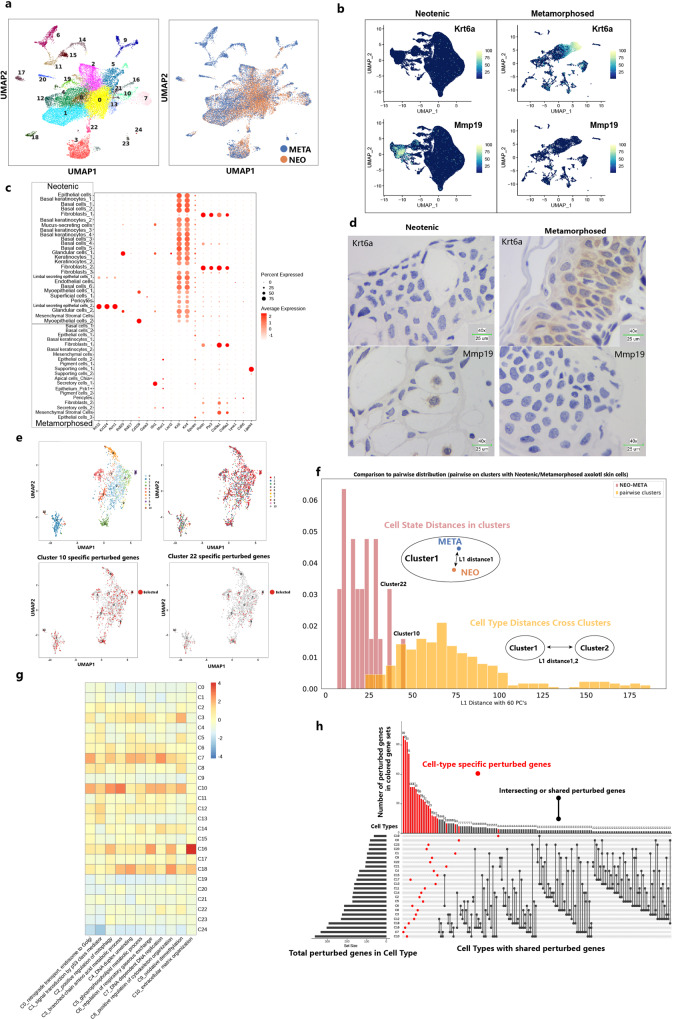
Fig. 6. Perturbation of skin cell types in response to metamorphosis.
a UMAP visualization of downsampled single cells from neotenic axolotl skin and all single cells from metamorphosed axolotl skin (right: UMAP plot colored by neotenic axolotl (NEO) and metamorphosed axolotl (META); left: UMAP plot showing the cluster numbers). b Feature plots visualization of Umod, Krt6a and Mmp19 in original neotenic axolotl skin samples (left) and original metamorphosed axolotl skin samples (right). c Dotplot showing selected marker gene expression in the original skin cluster (Neotenic: original skin clustering of neotenic axolotl skin in Supplementary Fig. 3; Metamorphosed: original skin clustering of neotenic axolotl skin in Supplementary Fig. 4). d Representative RNA in situ hybridizations in skin probing for Krt6a and Mmp19 (blue: nuclei, representative images in neotenic metamorphosed axolotls are chosen from two independently animal experiment, scale bars are 25 μm). e UMAP visualization of extracted perturbed differentially expressed genes from merged clustering of single cells (top right: same UMAP plot in which genes were colored by perturbed cell types; bottom: highlight of perturbed genes in Cluster 10 and Cluster 22). f Histogram of L1 distances between centroids of neotenic and metamorphosed axolotl cells within each merged cluster versus pairwise L1 distances between centroids of all merged clusters. Cluster 10 and Cluster 22 harbored the largest internal distances and overlapping distances. g Gene ontology (GO) enrichment of perturbed genes in each merged cluster. h UpSet plot visualization for intersecting sets of “perturbed” genes (left bar plot: number of differentially expressed perturbed genes under metamorphosis in each merged cluster; The connected dots represent overlaps between perturbed genes in each cluster, differentially expressed perturbed genes in only one cluster are colored in red; top bar plot: number of perturbed genes in red gene module).

