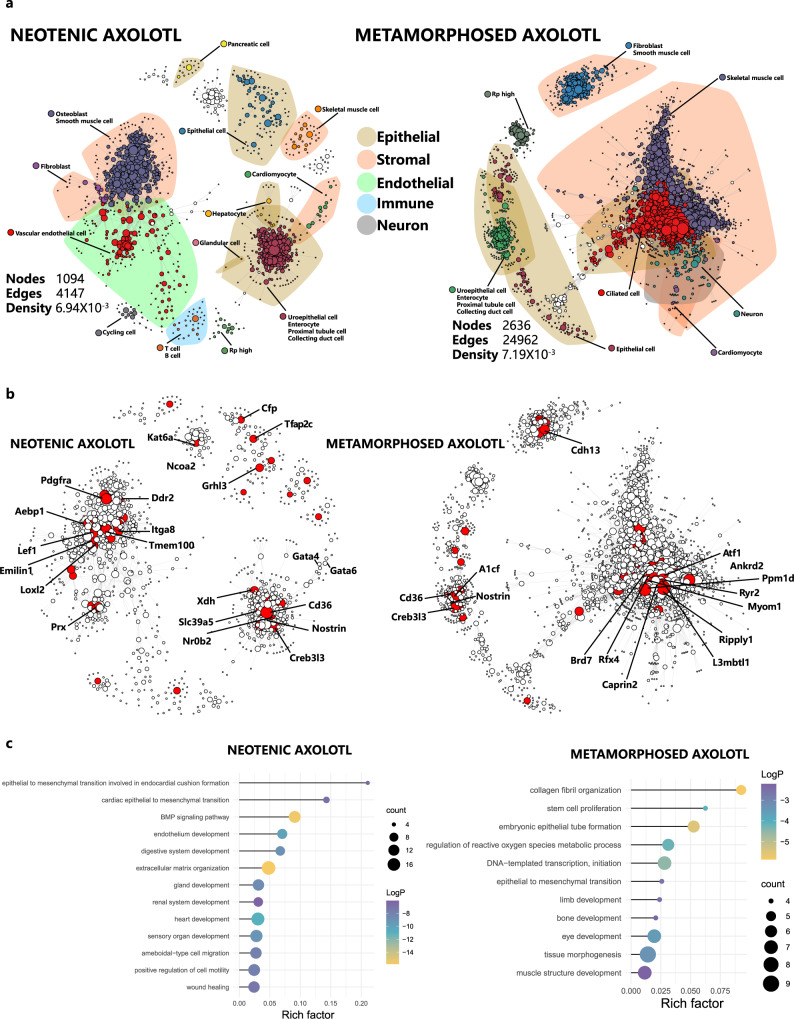
Fig. 7. Gene regulatory network analysis of neotenic and metamorphosed axolotls.
a Gene regulatory networks of neotenic axolotls and metamorphosed axolotls. Nodes represent network genes, and edges represent putative relationships. The size of nodes represents PageRank centralities. Calculated clusters are colored, and cell-type annotations are highlighted. Polygon shape covered annotated major cell types. b Same gene regulatory networks with the top 50 nodes ranked by PageRank centrality in the neotenic axolotl network and the top 100 nodes ranked by PageRank centrality in the metamorphosed axolotl network. Top nodes were highlighted in red. c Selected gene ontology (GO) enrichments of the top 100 differential PageRank centrality ranked nodes in the neotenic axolotl network and metamorphosed axolotl network (p values was calculated by the hypergeometric distribution, statistical test is one-sided, adjustments p values were made after p value is corrected by Benjamin & Hochberg multiple test).

