Figure 3.
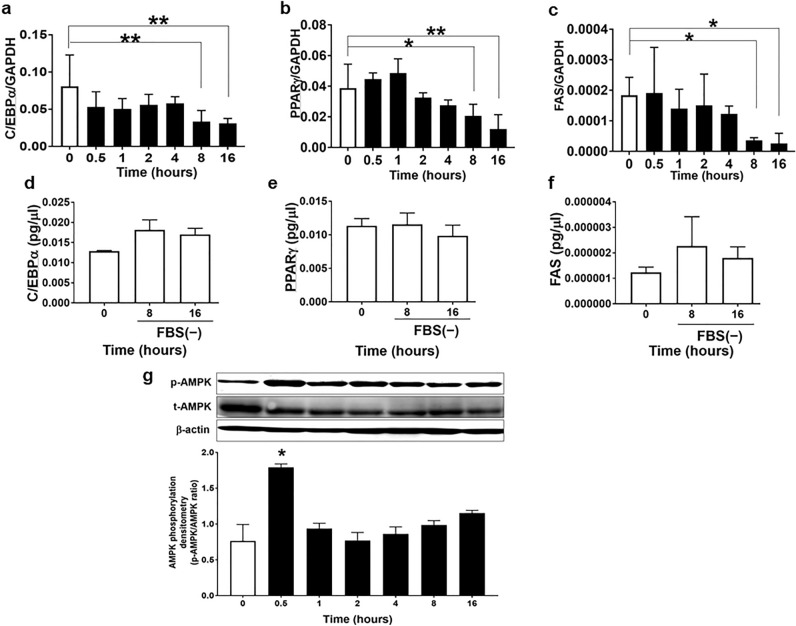
Cinnamon extract (CE) regulates lipogenesis marker expression in a time-dependent manner in 3T3-L1 adipocytes. (a–d) 3T3-L1 adipocytes were serum-starved for 8 h and then exposed to 30 μg/mL of CE for another 0.5–16 h. Real-time PCR was employed to determine mRNA expression of (a) C/EBPα, (b) PPARγ, and (c) FAS relative to GAPDH. Each value represents the mean ± SD of three different experiments (n = 3/group). *p < 0.05, **p < 0.01, compared with the control values. (d–f) 3T3-L1 adipocytes were serum-starved for 8 h and then maintained in serum-free culture for another 8–16 h. Real-time PCR was employed to determine the mRNA expression of (d) C/EBPα, (e) PPARγ, and (f) FAS. Each value represents the mean ± SD of three different experiments (n = 3/group). (g) 3T3-L1 adipocytes were serum-starved for 8 h and then exposed to 30 µg/mL of CE for another 0.5–16 h. The level of AMPK phosphorylation was measured via western blotting using total AMPK as loading controls. The image is a cropped blot and the full-length images of the western blot for the three experiments are provided in Supplementary Fig. S2b. In some images, different parts of the same membrane were cut out and reacted with different antibodies. The cutouts are clearly distinguished using yellow separator lines. Each value represents the mean ± SD of three different experiments (n = 3/group). *p < 0.05, compared with the control values.

